Surface Grids & Lasers | DevLog #10

Video: a Surface Grids data map of elevation displacement as fragments from a massive collision carve and crater Earth’s surface.
Surface Grids & Lasers are not yet available in Universe Sandbox! This post is a behind-the-scenes look at our work on these features. We don’t have a release date yet, but we’re getting closer every week.
If you haven’t seen them yet, check out the previous Surface Grids DevLogs #1, #2, #3, #4, #5, #6, #7, #8, and #9. Keep in mind these are documenting a work-in-progress feature. Anything discussed or shown may not be representative of the final release state of Surface Grids.
A primer on Surface Grids for anyone not familiar:
It’s a feature we’re developing for Universe Sandbox that makes it possible to simulate values locally across the surface of an object. In effect, it allows for more detailed and accurate surface simulation and more dynamic and interactive surface visuals. It also makes it possible to add tools like the laser, which is essentially just a fun way of heating up localized areas of a surface.
How to Build a Planet

In our last DevLog we welcomed Brendan, our new graphics developer. Brendan is jumping right into helping Georg, our senior graphics developer, with work on visuals for Surface Grids. His first project is building new tools for generating heightmaps.
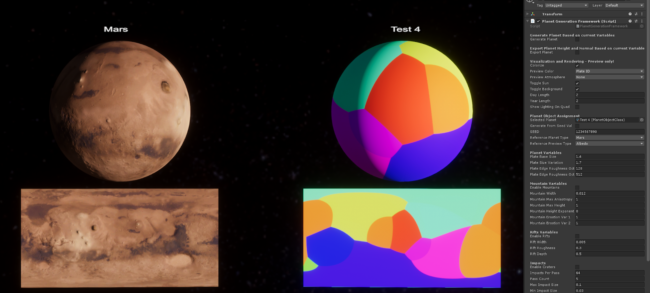
Our goals for this project: create a random heightmap generator capable of building known geological features in randomized configurations for planets, moons, and other objects. For example, it should be able to generate a heightmap for a planet that has features like large mountains and rifts, echoing what we’ve observed on surfaces in our Solar System, but ultimately unique in its configuration.
Additionally, it should be able to work with a combination of randomized and known data. For example, it should be able to sensibly fill in the missing gaps when we have limited data from real-life observations.
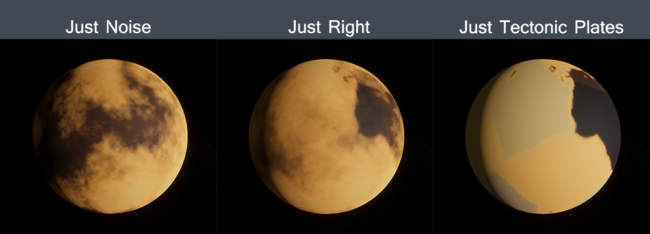
The trick with all of this is to find the balance between messy, randomized heightmaps that don’t result in any recognizable shapes or features, and clean-cut heightmaps that look overly designed and artificial.

So with these goals in mind, Brendan has come up with a recipe:
- Generate plates
- Generate large-scale features based on plate tectonics
- Add details
- Add impact craters
- That’s a planet
Plate tectonics: Please note that this does NOT mean that we are creating a simulation of plate tectonics within Universe Sandbox. We know this is a common feature request — and we agree it would be awesome to have — but simulating and showing the actual movement of plates over time is much more complex and is something for further into the future.
Instead, our plan is to use the concepts of plates and tectonics to generate sensible starting points for large-scale features in the heightmap. Then from there, we add smaller details like lakes or hills, pepper in impact craters for older surfaces, and voila, there is the surface of a planet. (Of course, this results in just the heightmap, which informs rather than is the surface visualization.)
Keeping Tabs on Your System
In DevLog #4, we shared some mockups for some of the new user interface (UI) that’s part of Surface Grids. The most important part is the new data map, which shows the Grids data in a nice and colorful 2D map of the surface.
The map is a gateway to understanding the benefits that come with the Surface Grids feature: instead of seeing a single value in a textbox for a property like Temperature, there are now thousands of color-coded points all changing and moving across the surface as heat diffuses and the temperature adjusts to the factors of the simulation.
But beyond helping with understanding what Surface Grids is doing, the map is also a powerful tool for monitoring the data. And sometimes, you want to view data for multiple objects at the same time, so you can keep tabs on how the planets and moons in your system are changing in the simulation.
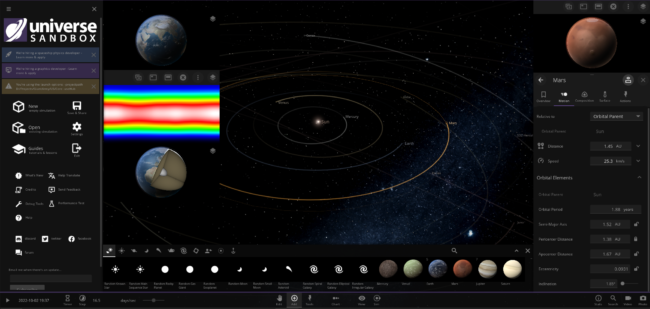
With the new map UI, you can “pop out” a map from an object’s Properties panel and dock it to the left side. Then you can set it to view different Surface Grids data or the standard surface or composition view, and you can stack them for different objects. Chris has been working on implementing the mockups for the map and its docking functionality, which can be seen on the left:

Unrelated to Surface Grids, one of our other developers, Jonathan, has been working on some styling changes to the user interface, adjusting things like font size, colors, and margins. They’re smaller changes on paper, but we think the improvements really make the whole interface look and feel better. Just part of our constant quest to make Universe Sandbox better and easier to use.
What’s Next
This has probably been said in a previous DevLog, but it’s worth repeating: Surface Grids is a big and complex feature. We know we’ve been working on it for a while, and it may seem like progress is slow-moving, but we really are moving along at a good pace — there’s just a lot to do. Since the last DevLog, Universe Sandbox astrophysicist and developer Jenn has fixed a handful of temperature issues, so now planets are created at, and settle into, more accurate temperatures. There are lots of little issues like this that come up when building a complex simulation of something we know so well, like Earth.
So now we’ll continue with more fixes to the simulation and the visuals, more work on the UI, more improvements to the heightmap generation, and more of everything else that helps make Grids fully functional. Hopefully we’ll have an opt-in experimental build soon. We thank all of you for your patience!

about 5 years ago
I hope that tectonic plates will be simulated in the near future.
about 5 years ago
I hope so too.
about 5 years ago
When will we be getting the release date? I’m getting ready for the HYPE TRAIN to arrive. Exited as all nuts and bolts rn for Surface Grids
about 5 years ago
Das ist die beste Simulation, die ich in meinem Leben jehmals gesehen habe. Sie kann selbst nicht astronomieinterresierten Menschen die Bedeutung von Raum und Zeit vermitteln! Eine unglaubliche Innovation für das Verstehen von Raum und Zeit!
about 5 years ago
When will we be getting atmospheric scattering?
about 5 years ago
Sorry, we don’t have any estimates for when this will be available yet. We’re not actively working on it right now, but it’s definitely on our to-do list.
about 5 years ago
How about adding oxygen as a material or gas?