Surface Grids & Lasers | Dev Update #2
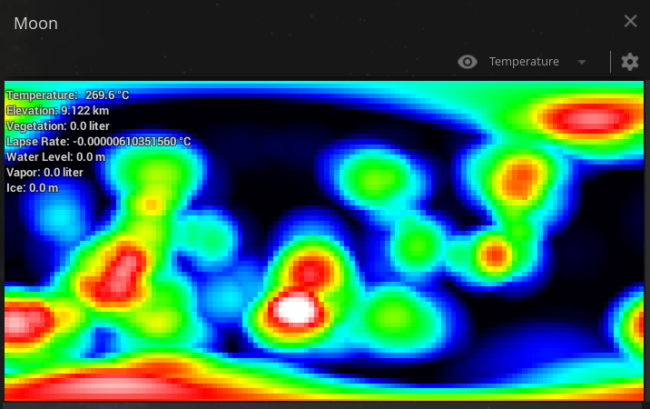
Image: A work-in-progress view of temperature data for the Moon’s surface during Bombardment of the Moon simulation
Here’s our round two update on the development status of Surface Grids and Lasers.
A primer on Surface Grids for anyone not familiar:
It’s a feature we’re developing for Universe Sandbox that makes it possible to simulate values locally across the surface of an object. In effect, it allows for more detailed and accurate surface simulation and more dynamic and interactive surface visuals. It also makes it possible to add tools like the laser, which is essentially just a fun way of heating up localized areas of a surface.
If you haven’t seen it yet, check out our blog post from a couple of weeks ago (we’ll call that Dev Update #1) where we talk about our decision to delay Surface Grids in favor of a rewrite that will better meet our Quality Standards for Awesome Features.
Keep in mind this is a development log for a work-in-progress feature. Anything discussed or shown may not be representative of the final release state of Surface Grids.
Getting Up to Speed
We’re happy with the progress that we’ve made so far on the new Surface Grids. We haven’t encountered any significant roadblocks (knock on wood) and the results we’ve seen are very promising.
Feature development in the beginning can be very exciting, because it can seem relatively quick to set up a framework, especially with a feature like this, where it’s a rewrite of a model we put a lot of work into. Early technical implementations can also give us a good sense of what’s to come and what is possible. At the same time, they can be a little less accessible from an outside perspective because they don’t have any of the polish and pizazz of a complete feature. At this point progress can also be a bit misleading, because often times the longest and most challenging part of development comes later, when we’re tweaking, polishing, finding and fixing bugs, and making sure all the complexities of the fully fleshed out model play nicely with each other and the rest of the simulation.
But let’s not get too ahead of ourselves — here’s a look at the progress we’ve made so far.
Zoom, Enhance!
As mentioned in our last post, concerns about performance with our old model played a significant part in our decision to do a rewrite. Performance relates directly to the resolution of the model: a higher resolution means more computations and slower performance. But the resolution of the model determines just how detailed the data and visuals can be, so a lower resolution model makes it that much less interesting.
The old model was scalable and the image below represents a fairly low resolution for the model, but it was also the baseline that we were working with because of performance concerns. In other words, we could run it at a higher resolution, but performance quickly took a hit once there were a bunch of objects in a simulation all running Surface Grids. Turning down the resolution helped, but not enough.
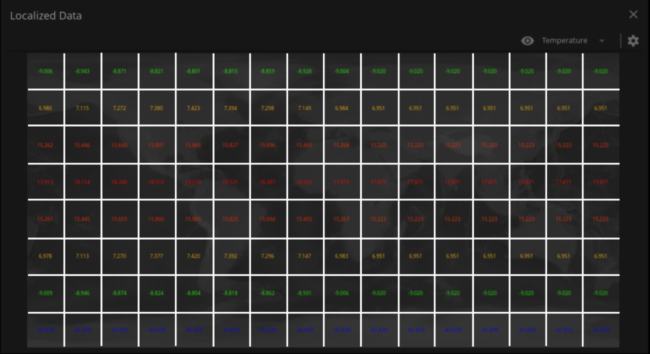
Compare that with the resolution of this new model, where each pixel is equivalent to a grid square in the above image.
See the difference? Generally speaking, the new version of Grids is at least 100 times faster than the old version. Yes, that is much, much faster. And it makes us very, very happy.
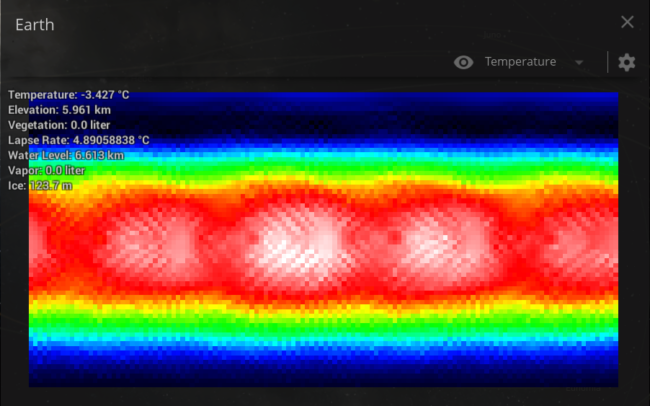
This clip shows a data map of Earth’s temperature as it becomes tidally locked. And, importantly, there are also 99 other Earths in this simulation all running their own equally high-res Surface Grids model.

A big thank you to our lead developer, Chris, for creating this new, powerhouse version of Surface Grids.
Water World
There’s another new feature in this model that we didn’t have before: simulated water flow.
Currently water flow is affected by elevation, which in turn can be affected by impacts. Our wish-list for the future of Surface Grids includes elevation-editing tools, but right now we’re not expecting those anytime soon (including the first release version).
This clip briefly shows typical water flow on Earth (currently the model runs even while paused) before it’s affected by an impact with the Moon.

Water flow is a pretty experimental aspect of the model right now, so it’s especially likely this will change significantly as we continue development.
Getting the Data Right
We’d consider the whole of Surface Grids a wash if the data wasn’t based on science. But good news: it sure is based on science.
Jenn, Universe Sandbox astrophysicist and developer, has been busy getting all the data and numbers right in the technical framework. Sometimes a model will produce interesting and compelling results, but if the numbers aren’t based in science and the results aren’t showing what we’d expect to see for an accurate (though simplified) model, then it doesn’t meet our goals for a Universe Sandbox feature.
Building an accurate, generalized model for this is no easy task. It has to handle a range of materials (silicate, water, etc.) at different phases (solid, liquid, gas), all determined by other factors like elevation and temperature; each point has to interact with the rest of the grid, the rest of the Universe Sandbox simulation, and any user input; it has to run in real time; and in a normal state, it has to produce something that looks like the Earth or Mars we’re familiar with. Fortunately, this is well tread territory at this point, as Jenn solved a lot of these problems with the last model of Surface Grids.
What’s Next for Grids
We feel very good about the progress we’ve made so far and we plan to keep moving forward at this pace. We’ll continue with the technical implementation while also adding and double-checking the scientific layers of the model.
You’ll notice in the tidal-locking clip above that we only showed the data map, not the actual planet itself, as its local temperature shifted. That’s because there’s not much to see yet (compare to the visual state of the last model as seen in the last post). We love data, but we also love planet surfaces that look pretty and glow. The surface visuals are an important part of Surface Grids, and now that we have the technical framework laid out, it’s time to make it look good. Our graphics developer, Georg, is just getting started on these visual aspects, which are also based on his previous work on the old Grids model. We look forward to sharing his work in a future Grids posts!