Science
Orbital Resonance in Universe Sandbox ²
Apr 8th
Universe Sandbox ² is as much about breaking the rules as it is following them. This is why you’re given the ability to add Saturn-like rings to any body, whether it’s Earth, Mars, or even the Sun. And it’s also why we allow you to put in all kinds of interesting but unrealistic shapes for the ‘rings,’ like spirals and cubes. But, of course, we are also committed to incorporating and simulating as much science as we can. So we’ve included resonance gaps.
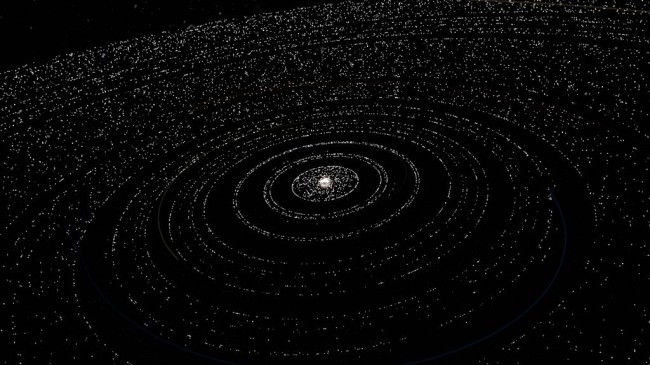
The basic idea here is that a larger body, like a moon (in the case of a ring around a planet), or a planet (in the case of rings around a star) creates gaps, or resonances, as seen in the picture above.
Here’s how it works (and for simplicity’s sake, just imagine circular orbits): According to Kepler’s third law, the distance an object is away from the planet determines how long it takes to orbit. That means that for an object at a given distance (and orbital period), there must be a distance where the orbit takes only half the time, and another distance that takes three times as long. Whenever the two orbits take integer ratios of each other, we say the orbits are in resonance. For example, if the moon takes 28 days to orbit, there is a distance that only takes 14 days to orbit. This would be the 2:1 resonance (two orbits for every one orbit of the moon). If there is a disk present, and there is material at that distance, then every other time the material in the disk orbits, the moon has gone the whole way around, and the disk material comes as close to the moon as it can get — basically they are in the same part of their respective orbits. Each time that happens, the moon’s gravity pulls on the material just a little bit. For certain ratios of orbit periods, this little extra pull will clear the material out of that particular orbit. It’s really an amazing process that takes a fair bit of time to occur. But we see it in Saturn’s rings and we see it in the asteroid belt, where resonances with Jupiter have cleared out gaps (the Kirkwood gaps). And here is a great little animation showing resonance in Jupiter’s moons.
We calculate a handful of unstable resonances (3:1, 5:2, 7:3, 2:1, 7:6, and 1:1). So when you’re playing around with Universe Sandbox 2, and you include resonance gaps, you’ll see these rifts in the rings. If you select the Sun and try to add rings, we find the planets that orbit the Sun, compute the resonances, and put gaps there, as pictured above. It’s pretty slick, if I do say so myself.
This feature includes the gaps when a ring is placed around an object. But Universe Sandbox is a gravity simulator, and this is a gravitational process. In principle, the gaps would develop on their own if you let the simulation run long enough. In practice, though, the simulation would need very, very high precision and to run for a very, very long time, and until we are running Universe Sandbox on a supercomputer, ring gaps won’t develop spontaneously.
You can also place your own rings by specifying the inner and outer boundaries of a single ring. So you could build up a single ring system with gaps anywhere you’d like them to be. We hope you have fun playing around with this feature when we make Universe Sandbox ² available for purchase. I sure had fun coding it up.
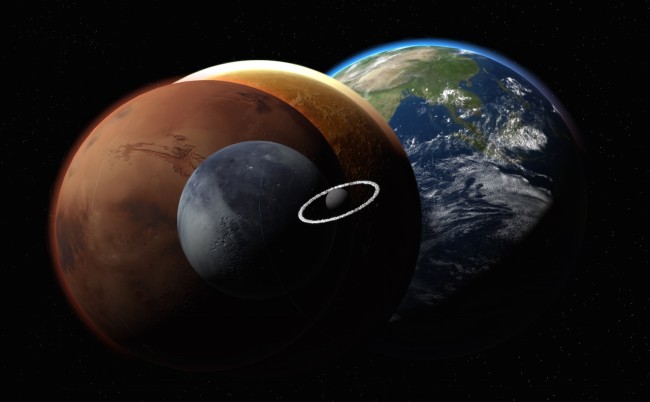
In other ring-related news, it was announced last week, to everyone’s surprise, that an asteroid in our Solar System called Chariklo has 2 rings. Here it is in Universe Sandbox ²:
Why do small stars not age past 12.6 billion years in Universe Sandbox ²?
Jan 10th
Universe Sandbox ², currently in development, is a powerful gravity simulator that invites you to learn about our amazing universe and fragile planet via an expanding realm of realistic, interconnected astronomy and climate physics systems. Read more about this upcoming version here: The New Universe Sandbox. Or find out how to purchase the currently available version at universesandbox.com/buy/.
Q: In Universe Sandbox 2, small stars, such as red dwarfs, stop aging when they reach 12.6 billion years old. Why is this?
A: Stellar evolution is incredibly complicated. We understand the basics of it quite well, and for a lot of stars, our models do a really good job of matching up to measurements of real stars. It is, however, very hard to do this right, for several reasons:
1. We don’t have perfect data.
We can’t directly measure the mass or radius of a real star. And even something like the temperature of a star isn’t always easy to measure. This means that a lot of the data are rough estimations.
One really big issue is what astronomers call ‘metallicity’. Basically, what is the relative fraction of elements in a star? How much iron is there, relative to hydrogen, etc?
2. We can’t actually observe the evolution of a single star.
We can watch it, but so far, we’ve only been watching for maybe a few decades or so, depending on when you consider our technology to have been good enough to do any of this. In star years, that’s not even a blink of the eye. So we have to make assumptions about the way a star will age by looking at other, older stars. It’s like looking at a whole bunch of people and guessing how you will age by seeing what older people look like right now. You can make an estimation, but it won’t be exact, because how you age depends a bit on what you eat, what happens to you, your genes, etc., and these factors are inevitably different than those of the older folks. Similarly, we can guess what the sun will do, but it has slightly different properties of the stars we think it will look like.
3. We can’t see inside a star.
And this is where most of the action happens. So this is all based on physics calculations. We’re good at that, but not perfect.

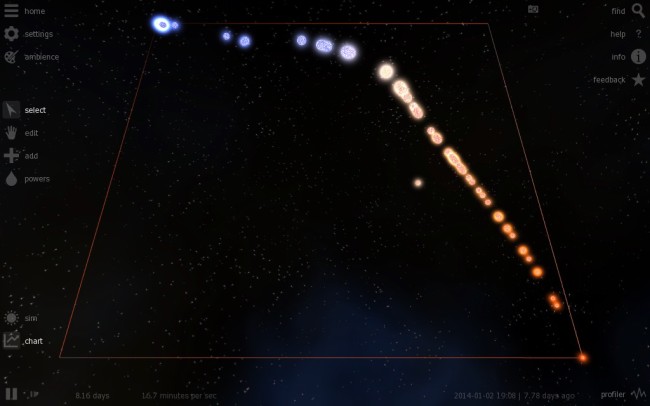
Hertzsprung–Russell diagram in Universe Sandbox. The HR Diagram (star’s temperature versus luminosity) was introduced in the early 20th century and helped pave the way for a better understanding of stellar evolution.
Okay, now on to how this directly relates to Universe Sandbox ²:
Since stellar evolution is so hard, we let the full-time, professional astronomers compute the models. We’ve adopted a whole suite of these stellar evolution models, or “isochrones.” These isochrones tell us the temperature, radius, and luminosity for a range of stellar masses and ages, and we turn that data into what you see in Universe Sandbox.
Unfortunately, although these isochrones are quite good and pretty accurate, they don’t give us predictions for very low-mass stars (less than 10% of the Sun’s mass) or very high-mass stars. And they don’t give us predictions for longer timeframes, such as 12.6 billion years (recall the age of the universe is a bit less than 14 billion years).
So this is what we’re stuck with for the time being. In the future, we’re planning on incorporating some other isochrones that are focused on lower-mass stars (which call for different physics, since the stellar atmospheres are very different; at low temperatures, molecules and even clouds can form in the stellar atmosphere, requiring different models), higher mass stars, different metallicities, and longer timeframes.
This is a work in progress, but we’ll be making it better and better as we go.
Follow the links below to read more about stellar evolution and some of the terms used in this post.
http://en.wikipedia.org/wiki/Stellar_evolution
http://en.wikipedia.org/wiki/Stellar_isochrone
http://en.wikipedia.org/wiki/Metallicity
http://stev.oapd.inaf.it/cgi-bin/cmd
Our World is Warming
Mar 17th
 Scientific insight from the group (NASA) that uses science to successfully launch rockets shows that our world is warming.
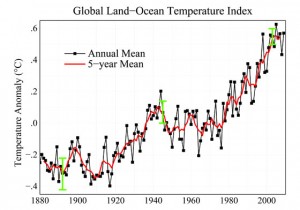
This past year, 2009, and 2005 were the warmest years recorded since humanity started keeping track. This past decade, 2000-2009, was the warmest decade on record.
NASAs new website, A Warming World, is a wonderful collection of “articles, videos, data visualizations, space-based imagery and interactive visuals that provide unique NASA perspectives on this topic of global importance.”
http://climate.nasa.gov/warmingworld/
Despite the fact that it snows, our world is warming. The evidence is overwhelming.


