DevLog
Surface Grids & Lasers | DevLog #9
Aug 30th
Video: Building a gigantic, snow-capped mountain by increasing elevation
Surface Grids & Lasers are not yet available in Universe Sandbox! This post is a behind-the-scenes look at our work on these features. We don’t have a release date yet, but we’re getting closer.
If you haven’t seen them yet, check out the previous Surface Grids DevLogs #1, #2, #3, #4, #5, #6, #7, and #8. Keep in mind these are documenting a work-in-progress feature. Anything discussed or shown may not be representative of the final release state of Surface Grids.
A primer on Surface Grids for anyone not familiar:
It’s a feature we’re developing for Universe Sandbox that makes it possible to simulate values locally across the surface of an object. In effect, it allows for more detailed and accurate surface simulation and more dynamic and interactive surface visuals. It also makes it possible to add tools like the laser, which is essentially just a fun way of heating up localized areas of a surface.
New Highs & Lows
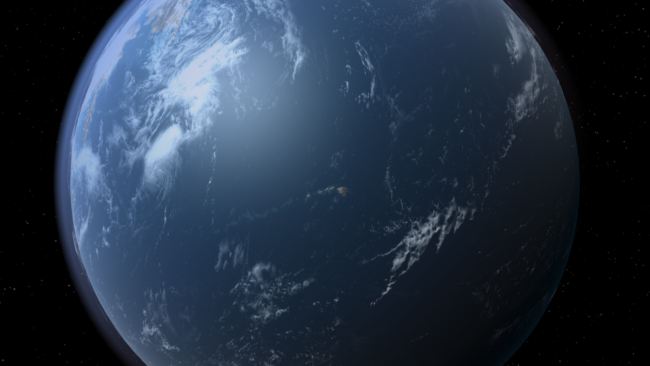
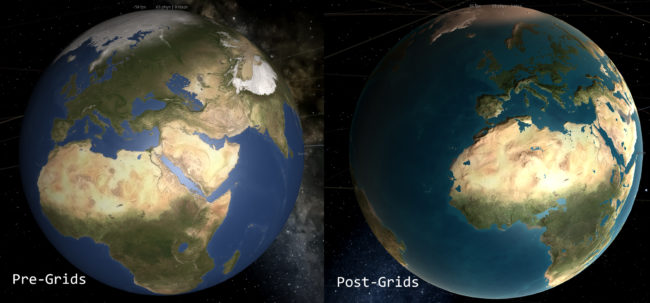
See that archipelago in the middle of the ocean? Those are the great Hawaiian islands. We’ve been tweaking the heightmap for Earth to get all the details right, and we’re happy to welcome back Hawaii and the full coastline for Florida. There are some details to iron out still, like the large body of water that’s currently sitting in the middle of Australia.
It’s a bit difficult to get the coastlines and bodies of water correct for a planet we’re all intimately familiar with — any errors are quickly noticed by a geography whiz or anyone who lives near the area that’s incorrectly flooded or barren.
This difficulty is due to a current limitation in the elevation simulation: When we divide the full range of elevation for Earth into the limited steps we have available for storing the data, we get 83 meters per step. This means the maximum detail we can account for is 83 meters. And unfortunately, geography doesn’t often look like 83 meter ocean-side cliffs. A lot of coastline is much closer to sea level, and the smaller distinctions between land and water are lost. We have ideas for improving this, but for now, some hand-tuning of the heightmaps can get us the results we’re looking for.
Creating Continents
Another issue we’re grappling with is the state of heightmaps for randomly generated planets. Right now, adding some water to a randomly generated planet will create bodies of water and land masses as you’d expect, but the results look less like geological formations and more like noisy data.
This is something our lead graphics developer, Georg, has been wanting to work on, but his plate has been full with other aspects of Grids. …Enter Brendan, our new graphics developer! Brendan will be working with Georg on graphics for Universe Sandbox, and first on his list is the not-at-all-complicated (wink) task of creating a random heightmap generator capable of building known geological features in unique, random configurations. We’re happy to welcome Brendan to the team. Hopefully we’ll have some screenshots of his work in our next devlog.
Making Mountains

Right now something interesting happens when you hold shift while using the laser: it makes mountains. Or technically speaking, it raises the elevation. You can also decrease the elevation, too. So even if you don’t like the new and improved randomly generated heightmaps that we’re working on, you can go in and shape it yourself.
This functionality won’t remain attached to the laser, that’s just a temporary, developer-only solution until we build out the interface for this new tool. We’re pretty sure you’re gonna like it.
In the video above, we’ve divided a planet with a mountain range and then flooded one half, creating one hemisphere of ocean and another of land.
What’s Next
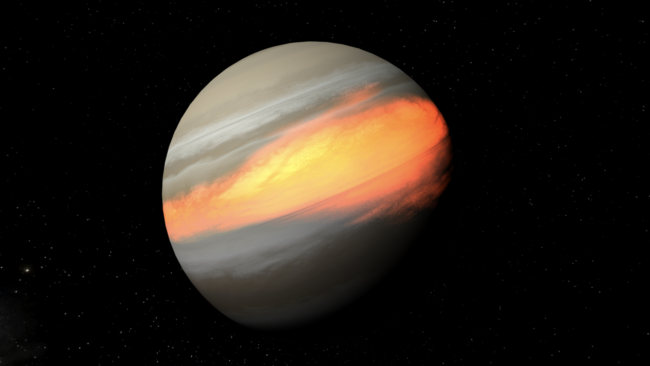
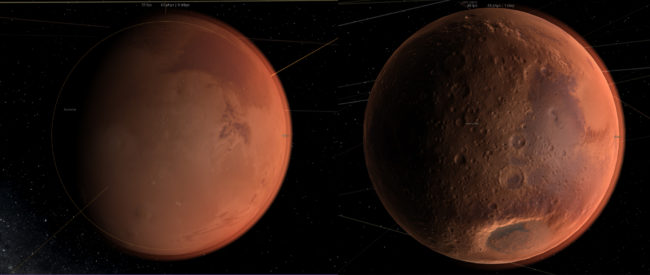
In addition to working on these various aspects of heightmaps and elevation, we’ve been doing a lot of work in other areas of the Grids simulation and tech, like getting visuals working on gas giants and planetoids (see above) and making the auto setting for lasers a bit smarter.
Up next is patching up all the holes we find as we continue to poke at the simulation. We also want to add a lot more visual detail to the edges of different areas like ice and molten surfaces to make it look a bit more natural. And there are plenty of other improvements and fixes to make.
We’re only kind of joking when we say it’s getting harder to pull ourselves away from playing with this feature so we can actually work on it. But in all seriousness, we continue to make good progress and we’re really liking the way it’s coming together. We can’t wait to share it. See you in our next devlog!
Follow @universesandbox
Surface Grids & Lasers | DevLog #8
Aug 9th

GIF: Filling in the Moon’s craters with ice.
Here’s our round eight DevLog on the development status of Surface Grids and Lasers. Thanks for everyone’s patience with this blog post. We took a little break from Surface Grids to talk about our work on Magic Leap in our last post — check it out to see planets bouncing off of walls and our new, floating user interface. And if you haven’t seen them yet, check out the previous Surface Grids DevLogs #1, #2, #3, #4, #5, #6, and #7.
A primer on Surface Grids for anyone not familiar:
It’s a feature we’re developing for Universe Sandbox that makes it possible to simulate values locally across the surface of an object. In effect, it allows for more detailed and accurate surface simulation and more dynamic and interactive surface visuals. It also makes it possible to add tools like the laser, which is essentially just a fun way of heating up localized areas of a surface.
Keep in mind this is a development log for a work-in-progress feature. Anything discussed or shown may not be representative of the final release state of Surface Grids. Read: Surface Grids & Lasers are not yet available in Universe Sandbox! To make this more clear, we’re now calling these posts DevLogs instead of Dev Updates.
Random Improvements
Everyone likes Earth and the rest of the cool, popular planets that make up our Solar System, but sometimes you want something a little different. That’s why we have the randomly generated planets. And with Surface Grids, the randomly generated planets are getting a little makeover.
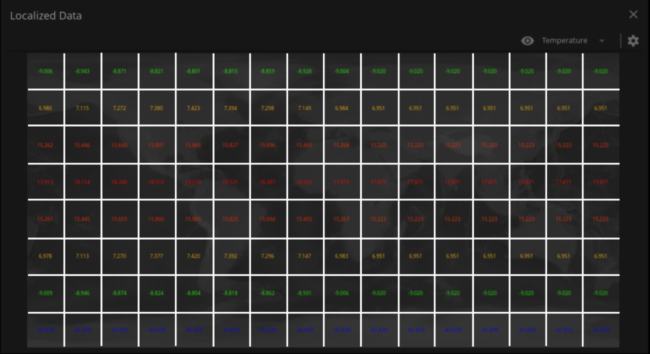
We now have new textures and new elevation maps (which you can now see in the data map) that spruce these up and make them more unique. And we have further plans to improve how these are generated to widen the range of possibilities and customization.
Water Your Planet

It’s been possible for a while now to add water to planets in Universe Sandbox. But it’s never looked so good as it does with Surface Grids.
The key components to this improvement are great examples of what make Surface Grids an awesome and powerful new feature. It’s all about the localized data: First, you can see that the water spreads locally. Before Surface Grids, water would just fill in across the whole surface, regardless of where it hit. Second, you can see the direct correlation between elevation and water level. This was sort of possible pre-Surface Grids, but now there’s a data map for both of these that makes it even easier to see this in action (see screenshot below). And third, you can see the water freeze and the ice melt locally as well. That’s the nice localized temperature part of it.

Watch Your Step
Detouring from how awesome Surface Grids is, let’s look at one of its fundamental challenges. As with most simulation features in Universe Sandbox, Surface Grids has to battle against the simulation time step (the rate at which the simulation runs, for example 10 days per real-time second). We know that it would be awesome if you could just set the time step to whatever rate you wanted and it would just work, but that’s unfortunately not possible, at least not without sacrificing accuracy.
This fact is most obvious with gravity simulation in Universe Sandbox. The simulation automatically sets a limit to how fast the time step can go while still maintaining relatively accurate orbits. And if you try to set it faster than this limit, you’ll see a message that it’s not safe to do so. For Surface Grids, we’ll need to add a similar warning system, as it too has a limit for accurate results.
A good example of time step limits for Surface Grids is in the simulation of water flow. This is simulated by moving X volume of water from one cell to its neighboring cell each step. The maximum volume of water that can be moved in each step is the maximum volume contained in that cell — it can’t transfer water that it doesn’t have. So if you’re running at a time step that is already moving the maximum amount of water and you try to increase the time step further, the data starts to get a little weird.
We have some ideas for improving this, but ultimately there’s no way around time step limits. Our hope is that we can make a smooth experience by communicating where these limits are while allowing you to exceed them at the risk of accuracy loss.
What’s Next
We’re feeling really good about our progress on the Surface Grids feature. Now that we have the visuals and systems working for random planets, it’s time to turn to planetoids and gas giants. We also want to work on visualization for vapor, but that’s one of the few remaining items that still need a connection between data and graphics.
There are some more apparent issues to work through yet, too, like getting water levels to initialize properly on Earth. Then there are the new elements of the user interface (UI) that we’ve designed but have yet to add, and some questions about UI interaction that come up as we continue to play around with Surface Grids. And of course there are the inevitable giant bugs running around that have to be squashed.
All of this will definitely keep us busy, but the pile of tasks gets smaller every day as we get closer to releasing an experimental build and getting out the official update. We still can’t say when either of these will come yet — we thank you for your patience.
We’re also still working on a smaller update that will introduce some improvements and bug fixes for the new galaxies added in Update 23, plus a new introductory experience. Hopefully we’ll have this ready soon!
Surface Grids & Lasers | Dev Update #7
Jul 11th

GIF: Lasering away the ice on Earth.
Here’s our round seven update on the development status of Surface Grids and Lasers. If you haven’t seen them yet, check out Dev Updates #1, #2, #3, #4, #5, and #6.
We hope you’ve been enjoying the new galaxies we added in Update 23. We still have another round of improvements and bug fixes planned for galaxies, but we’re proud of what we released and we’re shifting our excitement back to Surface Grids & Lasers.
A primer on Surface Grids for anyone not familiar:
It’s a feature we’re developing for Universe Sandbox that makes it possible to simulate values locally across the surface of an object. In effect, it allows for more detailed and accurate surface simulation and more dynamic and interactive surface visuals. It also makes it possible to add tools like the laser, which is essentially just a fun way of heating up localized areas of a surface.
Keep in mind this is a development log for a work-in-progress feature. Anything discussed or shown may not be representative of the final release state of Surface Grids. Read: Surface Grids & Lasers are not yet available in Universe Sandbox!
Gotta See It to Believe It
In the past few weeks, our graphics developer, Georg, has been taking the visual foundation that was built into the last version of Grids and plugging it into the new model.
This includes 1) getting the basics down for the shaders handling different materials and phases, from water to snow to molten silicate 2) getting all of Earth’s vegetation in the right spots 3) adding lighting, including effects for diffusion and specular and rim lighting for solar and atmospheric effects 4) and adding normal mapping.
The normal mapping creates the effect of bumps and ridges, or in other words elevation changes for things like mountains and crater rims. For a lot of visual effects, we often start with more exaggerated settings then dial it back and tweak it until we reach a more realistic appearance. In the screenshots below, the bumps are very pronounced and make for surface features that wouldn’t be discernible when viewing from space. While it’s not realistic and we plan to tone it down for the default setting, we are considering exposing this value and letting anyone set it to however they prefer.
Please note that you can safely ignore the incorrect water levels right now. We’re well aware that Europe is completely flooded and we’re working on a fix (even if it may be an accurate representation of what human-caused climate change will do to Earth…).
This visual foundation now works for planets with known heightmaps, but it will eventually be applied to all procedurally generated objects. So whether you’re lasering Earth or a randomly generated rocky planet, you’ll see the nice lighting and normal mapping.
Graphics for Surface Grids are definitely still incomplete, but everything is coming together nicely. The screenshot below shows a tidally-locked, near-Sun Earth that is frozen on the far side and molten on the near side (note: it looks especially “clean” now because it doesn’t yet include additional visual noise from blurring, blending, and randomness).

Lasers!
We haven’t shared much about lasers yet, so let’s fix that. Before, lasers were hooked up to the data side of things, so you could see its effects in the data map, but that was about it. Now that we have the visual foundation described above and can see the effects of temperature on the planet itself, playing around with lasers just got more interesting.
We recently added a radius setting that multiplies the area of effect (the laser visual itself is not yet affected by this). So whether you want to melt the whole ice cap or you want to carve your name, you can do it.
In the case of the GIF shared at the top of the post (and maybe I’m just hungry right now), this reminds me most of decorating a cake. Especially the part at the end where I do away with careful decoration and just throw a bunch of icing (er, lasering?) on the top.
We often see debates in the Universe Sandbox community about these lasers — some say they’re unrealistic and not a good use of development time, and others will stop at nothing to get their hands on them.
To the first, naysaying side we say this: Yeah, lasers like this don’t exist (at least, not yet). But… what if they did? Universe Sandbox has always been about realistic simulation of fantastical scenarios, and we think this fits very nicely into that. As for development time, lasers are a tiny fraction of the larger work on Surface Grids. They’re essentially a nice side-effect of having a system like Grids that can simulate localized surface properties, much in the same way Grids will allow us to add basic life simulation in the future as well.
And to the laser fanatics we say this: Yeah, they’re fun. Thanks for your patience!
What’s Next
There are a few higher-level things we want to get working, like being able to locally deposit water and having vapor flow connected to axial tilt. And then there are some must-fix issues like proper water level on Earth and proper phase-handling for Venus (it shouldn’t look like it’s covered in liquid water, right?). There’s also more visual work to do with blending materials and phases and handling procedurally generated objects.
So we’re a long way from the starting gate, but we’re not quite in the final stretch yet. It may be fair to say we’re at the point that was described all the way back in the second dev update: “… often times the longest and most challenging part of development comes later, when we’re tweaking, polishing, finding and fixing bugs, and making sure all the complexities of the fully fleshed out model play nicely with each other and the rest of the simulation.”
We’re definitely interested in making experimental builds available to the community in the future, before we’re ready for a full release. We’re not ready to say when these will come yet, but we hope they’re not far away.
As always, thanks for your patience and support while we work on this next big, complex feature for Universe Sandbox!
Follow @universesandbox
Surface Grids & Lasers | Dev Update #6
Jun 23rd

Here’s our round six update on the development status of Surface Grids and Lasers. If you haven’t seen them yet, check out Dev Updates #1, #2, #3, #4, and #5.
This will be a smaller update than usual because we’re focusing our efforts on the last sprint for the new galaxies we’ve been working on. We hope you won’t have to wait long for their official release, but if you’re feeling impatient, you can check them out by opting into the experimental version.
A primer on Surface Grids for anyone not familiar:
It’s a feature we’re developing for Universe Sandbox that makes it possible to simulate values locally across the surface of an object. In effect, it allows for more detailed and accurate surface simulation and more dynamic and interactive surface visuals. It also makes it possible to add tools like the laser, which is essentially just a fun way of heating up localized areas of a surface.
Keep in mind this is a development log for a work-in-progress feature. Anything discussed or shown may not be representative of the final release state of Surface Grids.
Set Phases to Accurate
Our last dev update focused on the upcoming galaxies, but at the end we mentioned how Jenn, astrophysicist and Universe Sandbox developer, was working on vapor flow for the Grids model. We also joked that the challenging part here is creating this “accurately and performatively without single-handedly developing Weather Simulator 2020.” Unfortunately, the joke is all too real!
That doesn’t mean we are actually developing a complex weather simulator, but there is nonetheless complexity. While developing the vapor flow model, Jenn has been doing her homework with research into fluid systems and geophysics (if you’re looking for some light reading, you can check out Lectures On Dynamical Meteorology, Geophysical Fluid Dynamics, and An Introduction to Planetary Atmospheres).
The first part of vapor flow is determining what exactly is vapor; this is done by phase tracking, which determines what phase each material is in, based on temperature and elevation. For water, vapor is its gas state, then we need to see where it’s headed from there — whether it’s evaporating or condensing at the dew point, depositing, if it should be boiling away completely, etc. If it’s remaining as vapor, then the model accounts for a few factors to move it around: there are the prevailing winds which vary by latitude, are affected by planet rotation, and cause east-west movements (as seen in the GIF at the top), and there are temperature differentials from thermal flows and elevation that cause north-south movement (still a work in progress).
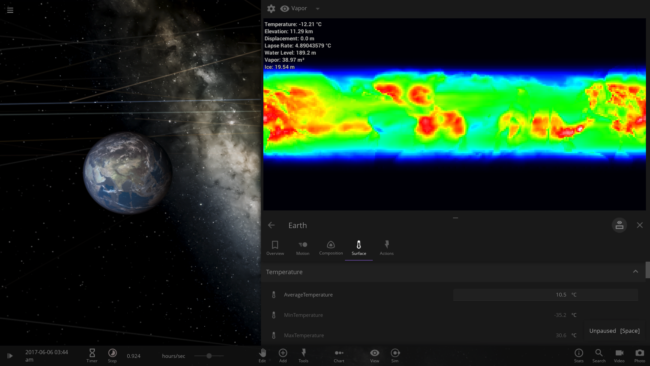
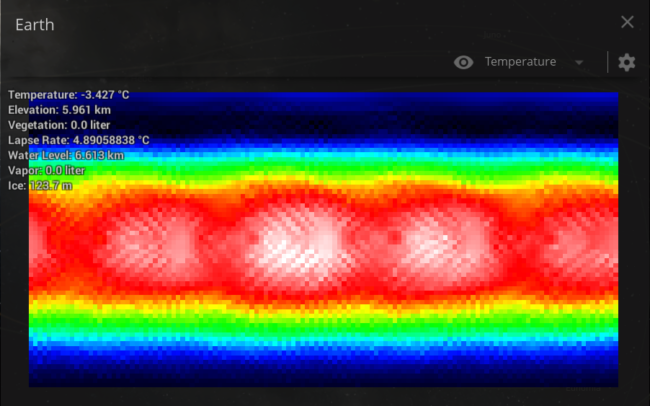
Image: The “heat map” shows vapor amounts (not vapor flow), where red is higher amounts and blue is lower. The poles are both much drier, and because there’s much less evaporation over land than oceans, you can see the outlines of the continents.
We want to stress that this is necessarily a very simplistic model, largely limited by its low resolution and the amount of memory we can allocate for this single component of Grids. There are lots of things missing that make this very different from more complex weather simulations — there are no vortices, so there won’t be anything like hurricanes, it is only a 2D simulation with no layers through the vertical dimension, and it’s fairly low resolution.
But we hope to use this data for the resulting local vapor amounts to have rough approximations for clouds, ice caps (for Mars, this effect happens with CO2 vapor flow), and for the future implementation of basic life simulation (vegetation), it could affect growth in dry and wet areas.
Loading…
In our last post, we also mentioned Chris’s work on saving and loading with Grids. This component of the feature obviously isn’t as interesting as, say, lasers, but at the same time, it’s essential to get it right and it’s another good representation of challenges on the edges of new feature development.
Here’s a shortlist of some of the questions and challenges that doesn’t even get into the technical weeds: How can we deal with file type and size limits for different platforms, like Steam Workshop, mobile devices, etc.? How can we maintain file size for fast, background autosaving and quicksaving? How can we get it to play nicely with previously saved simulations with objects that didn’t have all of the Grids data?
We had similar saving and loading questions with the new galaxies: What should happen if you load simulations that had the old galaxies? They won’t look and function the same. Should we change their shape and motion to use the new model, or should we preserve appearance? Is it okay to change sims on Steam Workshop that are very popular?
Saving and loading is something we all hope just works seamlessly and shouldn’t be something the player ever has to think about — which are both telltale signs that there is little room for bugs, errors, and bad user experience (UX). Thankfully, we have answers to all of these questions!
What’s Next for Grids
We’re hoping to make some good progress again on the visual side of Grids, rendering all of that wondrous data into some nice planet graphics. We’ve been recruiting our graphics developer, Georg, to work on some other projects (like the now so gorgeous galaxies), but it’s time for Grids attention again.
Thanks for reading! We’ll be back in two weeks with another update on development. And hopefully before that, we’ll have our next big update with new galaxies.

Galaxies & Grids | Dev Update #5
Jun 7th

For this developer update, we’re going to take a little break from looking at our work on Surface Grids & Lasers to turn our attention on the upcoming new galaxies (these are a work-in-progress and are not yet available in Universe Sandbox).
You can check out Dev Update #1, Dev Update #2, Dev Update #3, and Dev Update #4 for a more in-depth look at Surface Grids & Lasers.
Keep in mind this is a development log for work-in-progress features. Anything discussed or shown may not be representative of the final release states for these features.
A Whole New World (of Galaxies)
We’ve been saying for a while now — and the community has been making sure to regularly remind us — that the state of galaxies in Universe Sandbox has not been so good. There was a pretty good looking preset simulation for a Milky Way & Andromeda Collision, but when it came to adding any type of galaxy to another simulation, you were left wondering why they all looked like the same amorphous blob, why they were difficult to work with, and what exactly all those red dots were.
Case in point, here’s a Milky Way added to a simulation with the old galaxies:

And here’s a new Milky Way:

We hope you agree this is a massive visual improvement. But there’s more than just beautification happening. Here are the major parts that make up the new galaxies:
1. Black holes & nebulae
- A galaxy is a combination of a black hole and a number of surrounding nebulae (each of which represents a group of stars)
2. Individual, editable properties
- Select and edit properties for black holes, individual nebulae, or the whole galaxy
- Each includes typical object properties like mass, radius, rotation, position, velocity, etc.
- Unique whole galaxy properties include galaxy type (elliptical, spiral, and irregular), elliptical B/A ratio, spiral number of arms, and pitch angle
3. Accurate motion
- Orbital elements of the nebulae are set by galaxy type and determine overall motion
- Nebulae positions and velocities change as galaxy type and type-related properties (B/A ratio, pitch angle, etc) are edited
- Galaxies in isolation will retain proper motion and shape over time
- Galaxies perturbed by massive bodies (like another galaxy or an isolated, supermassive black hole) become irregular type galaxies
4. Data-driven visuals
- Nebulae have a Gas Fraction property that represents the ratio of gas (the material available for making stars) to stars as well as an average temperature property
- Combined, these properties result in red/yellow elliptical galaxies, bluer spiral arms, and a visible increase in blue star production in colliding galaxies
- Nebulae also have a Dust Fraction property that represents the ratio of dust (opaque material) to gas and stars (luminous material); dust traces spiral arms and blocks light from the galaxy when viewed edge-on

GIF: Editable properties and the different visuals for different types of galaxies.
5. Procedural generation
- Create a randomly generated spiral galaxy, elliptical galaxy, or irregular galaxy
6. Support for trails & orbits
- Show trails or orbits for individual nebulae, which provides insight into realistic galaxy motion
7. No more dark matter
- Proper dark matter simulation is very complicated and we weren’t satisfied with its implementation in our last galaxy model
- In the future we’ll have a more in-depth explanation of this in a blog post from Erika, Universe Sandbox astrophysicist and developer behind the new galaxies
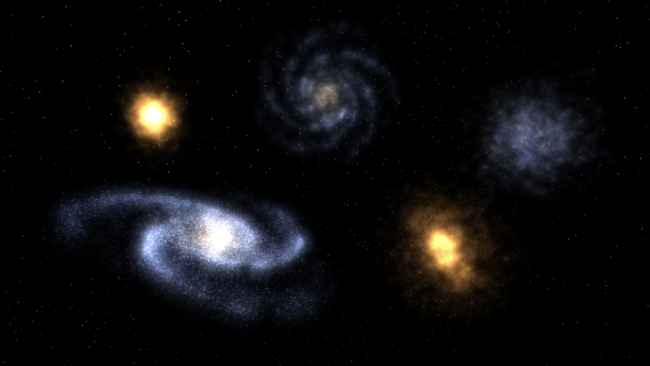
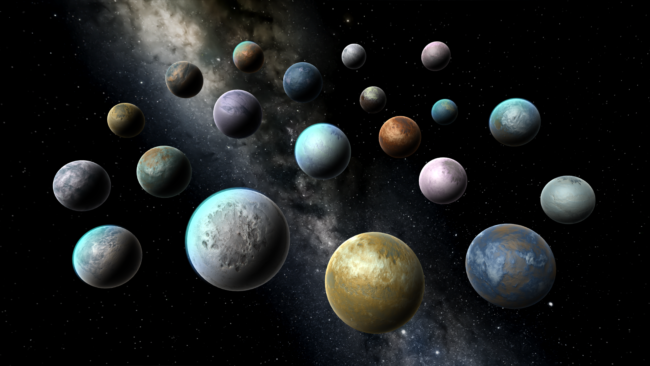
Image: A collection of randomly generated spiral, elliptical, and irregular galaxies.
The Future of Galaxies
We’re very happy with the status of galaxies right now. Before we can release them, there are some minor changes we need to make with the interface and other miscellaneous areas around the edges, and we still need a round or three of testing and bug fixes. But the simulation itself is in great shape.
When it comes to simulation features in Universe Sandbox, though, we almost never consider them a done deal. There are always improvements we have in mind for making them more realistic, performant, and fun to experiment with.
After the initial release of these new galaxies we’ll likely take a break from them for a bit. But here are some improvements and additions we’d love to explore more in the future:
- Barred spiral galaxies
- Visual representation of accurately-timed supernova flashes
- Values to show estimated numbers of stars in nebulae and total values in galaxy groups
- Randomization parameters for more “natural-looking” galaxies
- Run as fluid/SPH (smoothed-particle hydrodynamics) simulation
Surface Grids Sidebar
We’re hyped on galaxies and hope you are, too. Fingers crossed that the last stretch of finishing out this feature goes smoothly and quickly!
But of course, we’re also still working on Surface Grids & Lasers, so here’s a small update on those features:
Chris has been working on the saving and loading system for Surface Grids. This is a little less straightforward than it had been for saving and loading objects and simulations, due to the sheer amount of data that can be included with a lot of objects using the new Grids system.
Jenn has continued with making an accurate water vapor model, with the challenge of creating this accurately and performatively without single-handedly developing Weather Simulator 2020.
Georg has been applying his shader magic to galaxies and helping with proper rendering for Universe Sandbox on Magic Leap. Now that the graphics work for both of those are mostly finished, he’s got his eye on Surface Grids again as he continues to shape water data and heightmaps to get nice looking coastlines on Earth and other planets.
Stay tuned for another announcement about an opt-in version of Universe Sandbox that includes these new galaxies — we need to squash some of the nastier bugs still, but we’re getting close.
Surface Grids & Lasers | Dev Update #4
May 24th


Image: Interface prototype for Surface Grids data map.
Time for our round four update on the development status of Surface Grids and Lasers. If you haven’t seen them yet, check out Dev Update #1, Dev Update #2, and Dev Update #3.
A primer on Surface Grids for anyone not familiar:
It’s a feature we’re developing for Universe Sandbox (meaning it’s not yet available) that makes it possible to simulate values locally across the surface of an object. In effect, it allows for more detailed and accurate surface simulation and more dynamic and interactive surface visuals. It also makes it possible to add tools like the laser, which is essentially just a fun way of heating up localized areas of a surface.
Keep in mind this is a development log for a work-in-progress feature. Anything discussed or shown may not be representative of the final release state of Surface Grids.
Interfacing
In this update, we’ll take a close look at a part of the new user interface (UI) for the Surface Grids feature, specifically the data map. While the UI doesn’t affect the Grids simulation itself, it determines how easy and seamless it is to view and interact with the Grids feature. And as with other features and the experience as a whole, it is the UI and its accompanying user experience (UX) that ultimately determine how accessible and enjoyable Grids will be.
In previous posts about Surface Grids, we’ve shared screenshots that show a floating panel with a Grids data map, like this:

We had been using this panel for debugging, but it was never a representation of our end-goal for its design. We strongly believe that floating panels (the kind that can be dragged around the screen and can overlap) in applications and games can be very cumbersome; while they offer a lot of flexibility, managing them can become a task in itself. So instead of actually playing the game, you spend most of your time resizing them and moving them around to make sure they’re not in the way of the gameplay or other parts of the interface.
So instead, we try to create an interface where you don’t have to think about panels at all — where they’re intelligently docked, organized, and out of the way.
Below is a prototype that shows the Surface Grids data map first located within the Properties panel, then popped out to a larger view, then docked to the left. The panel is then duplicated and switched to a graph.
Disclaimer as always: Anything discussed or shown may not be representative of the final release state. It’s also likely this end-goal design (which is subject to change) will be reached over multiple releases.

Iteration Behind the Scenes
Dan is the creator and director of Universe Sandbox and he also leads the way in designing its UI and UX. Recently, Dan started using Adobe XD, a tool for designing, prototyping, and collaborating on UI/UX for applications. It has already proven a valuable tool in UI iteration for Surface Grids.
Designing for UI/UX can be challenging in its early stages because it’s often hard to get a sense of how it feels to actually use it until you can literally use it. Some things might seem great in design, but once you program it in, you realize that it lacks a certain flow, or feels awkward next to other interactions, and then it’s back to the drawing board. XD’s ability to create an interactive prototype can cut out this need to implement the UI for testing, which means it’s also easy to give others on the team a sense of what the designer is imagining. All of this can make the iterative process of design and feedback a lot faster and more efficient. (And no, this is not sponsored by Adobe! But we do enjoy their tools.)
Check out the interactive version of the prototype shared above: Interactive Surface Grids UI Prototype
This is very simplified and intended to only show new parts of the interface. You can click anywhere on the screen to highlight in blue the areas that can be clicked.
And here’s a behind the scenes look at Dan’s Adobe XD workspace for the above interactive prototype (large row on the right) and some other prototypes. Each rectangle is a different view of the UI, essentially creating interaction through branching paths triggered by click-areas.
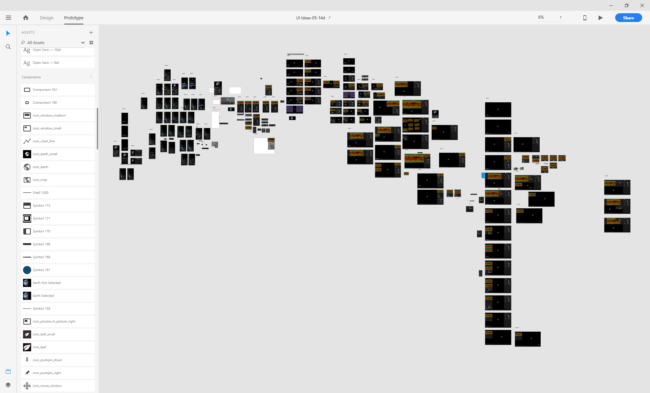
What’s Next for Grids
We can appreciate that showing the UI may not be as flashy as a GIF of a molten Earth, but we’d like to show how much work and iteration, from all different sides, goes into a single feature.
Chris is continuing to work on the technical implementation, Jenn is working through the science, and Georg is gussying it all up — we’ll back in two weeks to take another look at our progress.
Bonus Galaxy Preview!
We’re really looking forward to Surface Grids, but let’s not forget the new galaxies that are coming. Here’s a preview showing some recent visual upgrades and the ability to see orbital paths for the individual galaxy particles.

Surface Grids & Lasers | Dev Update #3
May 10th
Image: Early work on visualizing Grids data on a partially molten Earth, pre-beautification.
Here’s our round three update on the development status of Surface Grids and Lasers. If you haven’t seen them yet, check out Dev Update #1 and Dev Update #2.
A primer on Surface Grids for anyone not familiar:
It’s a feature we’re developing for Universe Sandbox that makes it possible to simulate values locally across the surface of an object. In effect, it allows for more detailed and accurate surface simulation and more dynamic and interactive surface visuals. It also makes it possible to add tools like the laser, which is essentially just a fun way of heating up localized areas of a surface.
Keep in mind this is a development log for a work-in-progress feature. Anything discussed or shown may not be representative of the final release state of Surface Grids.
Visualize It
In our last update, we talked about getting the new technical framework set up and working on the scientific-data side of Grids. In this update, we’ll focus on the third primary component of this feature: the visuals.
We can divide this visual component again into two separate challenges: 1) rendering the data accurately and 2) making it look good with visual magic.
Right now, our graphics developer, Georg, is working on the first part, rendering the data accurately. We talked before about the importance of getting the data right, but that’s really just the first step toward Grids as an accurate and interactive feature. The 2D data map that simply color-codes the data looks neat, but the first thing you see, and the thing most people want to look at, is the planet itself. So accurate data becomes much less useful if it’s not accurately represented in the planet visuals.
Visually representing this data is another tricky process. At its most basic, we need to nicely blend each possible material (silicate and water) with each of their possible phases (solid, liquid, and gas), as determined by elevation and temperature data. But it gets even more complicated: we need to account for elevation slope, the fact that phases aren’t just on or off but can exist somewhere in between (like partially-molten silicate), and the very likely possibility that seemingly opposite materials and phases can exist right next to each other (think of a high-powered laser melting ice).
From Coast to Coast

Another big challenge is working with the difference in resolutions. The Grids data is a low resolution compared to the visual resolution we expect for planets, especially ones that we are very familiar with, like Earth or Mars.
One good example is coastlines. In the GIFs above, take a look at the shimmering squares in the oceans. Each square is a point of Grids data. Compare that to the coastlines. If their outlines followed the same resolution, the continents would look more like a LEGO creation than the masses of land with all their nooks and crannies we’re so familiar with. We use a high-resolution heightmap for Earth, which works pretty well for accurate coastlines and large lakes. But the tricky part is getting this to play nicely with our lower resolution Grids data, so that only part of the Grids cell shows water and the other part shows land, i.e. accurate coastline.
All this talk of complex challenges makes it sound like this is difficult work. It sure is. But since this is a rewrite of Grids, we’ve done a lot of the heavy lifting already. Not to say it’ll be a walk in the park, but we at least have a good sense of what we’re up against.
Keep in mind these GIFs and screenshots represent works-in-progress and are tuned more to our current needs for development and debugging than they are for your viewing pleasure. All of this can and will change!
What’s Next for Grids
This has been another good couple of weeks for Grids development. There’s still plenty to do with getting the visuals right, plus eventually we have to turn our attention away from our favorite planet, Earth, to take a look at Mars and other randomized, generic planets and bodies.
Then once we start seeing all the data reflected accurately in the visuals, Georg will begin beautifying it with lighting, normal mapping (for bumps and dents), glows, etc, all the while multitasking with his work on the new galaxy visuals (read more about our work on new galaxies).
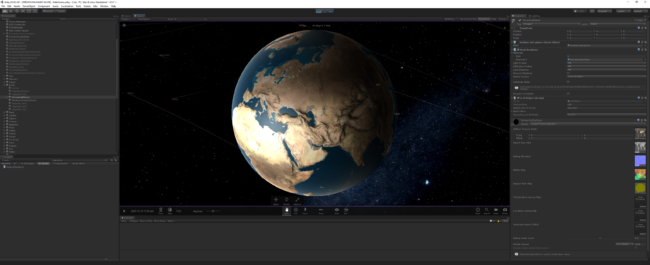
Here’s a glimpse of some preliminary graphics magic that demos improved lighting and emphasized normal maps (look at those ridges!), plus a bonus peek at part of our Unity development environment.
Thanks for reading! We’ll be back in two weeks with another update on Grids development.
Until then… did you know we started an official Discord for Universe Sandbox? Join us on Discord
All this graphics talk making you think it’d be a lot of fun to work on problems like these? Good news, we’re hiring a graphics developer! Learn more & apply
Surface Grids & Lasers | Dev Update #2
Apr 26th
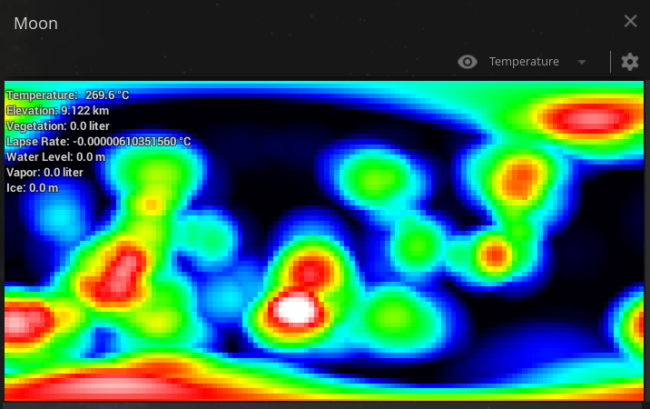
Image: A work-in-progress view of temperature data for the Moon’s surface during Bombardment of the Moon simulation
Here’s our round two update on the development status of Surface Grids and Lasers.
A primer on Surface Grids for anyone not familiar:
It’s a feature we’re developing for Universe Sandbox that makes it possible to simulate values locally across the surface of an object. In effect, it allows for more detailed and accurate surface simulation and more dynamic and interactive surface visuals. It also makes it possible to add tools like the laser, which is essentially just a fun way of heating up localized areas of a surface.
If you haven’t seen it yet, check out our blog post from a couple of weeks ago (we’ll call that Dev Update #1) where we talk about our decision to delay Surface Grids in favor of a rewrite that will better meet our Quality Standards for Awesome Features.
Keep in mind this is a development log for a work-in-progress feature. Anything discussed or shown may not be representative of the final release state of Surface Grids.
Getting Up to Speed
We’re happy with the progress that we’ve made so far on the new Surface Grids. We haven’t encountered any significant roadblocks (knock on wood) and the results we’ve seen are very promising.
Feature development in the beginning can be very exciting, because it can seem relatively quick to set up a framework, especially with a feature like this, where it’s a rewrite of a model we put a lot of work into. Early technical implementations can also give us a good sense of what’s to come and what is possible. At the same time, they can be a little less accessible from an outside perspective because they don’t have any of the polish and pizazz of a complete feature. At this point progress can also be a bit misleading, because often times the longest and most challenging part of development comes later, when we’re tweaking, polishing, finding and fixing bugs, and making sure all the complexities of the fully fleshed out model play nicely with each other and the rest of the simulation.
But let’s not get too ahead of ourselves — here’s a look at the progress we’ve made so far.
Zoom, Enhance!
As mentioned in our last post, concerns about performance with our old model played a significant part in our decision to do a rewrite. Performance relates directly to the resolution of the model: a higher resolution means more computations and slower performance. But the resolution of the model determines just how detailed the data and visuals can be, so a lower resolution model makes it that much less interesting.
The old model was scalable and the image below represents a fairly low resolution for the model, but it was also the baseline that we were working with because of performance concerns. In other words, we could run it at a higher resolution, but performance quickly took a hit once there were a bunch of objects in a simulation all running Surface Grids. Turning down the resolution helped, but not enough.
Compare that with the resolution of this new model, where each pixel is equivalent to a grid square in the above image.
See the difference? Generally speaking, the new version of Grids is at least 100 times faster than the old version. Yes, that is much, much faster. And it makes us very, very happy.
This clip shows a data map of Earth’s temperature as it becomes tidally locked. And, importantly, there are also 99 other Earths in this simulation all running their own equally high-res Surface Grids model.
A big thank you to our lead developer, Chris, for creating this new, powerhouse version of Surface Grids.
Water World
There’s another new feature in this model that we didn’t have before: simulated water flow.
Currently water flow is affected by elevation, which in turn can be affected by impacts. Our wish-list for the future of Surface Grids includes elevation-editing tools, but right now we’re not expecting those anytime soon (including the first release version).
This clip briefly shows typical water flow on Earth (currently the model runs even while paused) before it’s affected by an impact with the Moon.

Water flow is a pretty experimental aspect of the model right now, so it’s especially likely this will change significantly as we continue development.
Getting the Data Right
We’d consider the whole of Surface Grids a wash if the data wasn’t based on science. But good news: it sure is based on science.
Jenn, Universe Sandbox astrophysicist and developer, has been busy getting all the data and numbers right in the technical framework. Sometimes a model will produce interesting and compelling results, but if the numbers aren’t based in science and the results aren’t showing what we’d expect to see for an accurate (though simplified) model, then it doesn’t meet our goals for a Universe Sandbox feature.
Building an accurate, generalized model for this is no easy task. It has to handle a range of materials (silicate, water, etc.) at different phases (solid, liquid, gas), all determined by other factors like elevation and temperature; each point has to interact with the rest of the grid, the rest of the Universe Sandbox simulation, and any user input; it has to run in real time; and in a normal state, it has to produce something that looks like the Earth or Mars we’re familiar with. Fortunately, this is well tread territory at this point, as Jenn solved a lot of these problems with the last model of Surface Grids.
What’s Next for Grids
We feel very good about the progress we’ve made so far and we plan to keep moving forward at this pace. We’ll continue with the technical implementation while also adding and double-checking the scientific layers of the model.
You’ll notice in the tidal-locking clip above that we only showed the data map, not the actual planet itself, as its local temperature shifted. That’s because there’s not much to see yet (compare to the visual state of the last model as seen in the last post). We love data, but we also love planet surfaces that look pretty and glow. The surface visuals are an important part of Surface Grids, and now that we have the technical framework laid out, it’s time to make it look good. Our graphics developer, Georg, is just getting started on these visual aspects, which are also based on his previous work on the old Grids model. We look forward to sharing his work in a future Grids posts!