We’ve added a simple climate simulation to the Earth in Universe Sandbox. In doing so we wanted something that would give us different temperatures at different latitudes, so we could show the seasons come and go. Where it’s cold enough for snow and sea ice, we paint the Earth white.
We also needed something simple enough that we could do the calculations in real time. And we wanted something in the spirit of the sandbox, so that you can change other things about the simulation and see the interactions play out. So we needed to respond to changes in the orbit, to incoming star-light, and even let you play around with some of the model parameters themselves.
Finally we wanted to representatively illustrate the effect of Greenhouse gases in the atmosphere, including the changes in temperature that happen when we add more Greenhouse gases to the atmosphere due to human activities. What follows is the working documentation for this feature, and should help answer some of the questions you may have. See also the evolving FAQ.
– Naomi, and the rest of the Universe Sandbox team
Balancing Energy to Calculate Temperature
The energy balance of a planet determines the temperature at the surface. What is a planetary energy balance? The amount of energy coming in from the local sun is balanced by the outgoing energy emitted in the infrared. The hotter an object the more it emits in the infrared. One can set up an energy balance equation and solve it for the surface temperature.

In the simplest version it also depends on the albedo (or reflectivity): the amount of incoming energy from the star that is reflected back instead of absorbed. You can also specify the fraction of outgoing infrared energy that gets absorbed and re-emitted towards the surface by the atmosphere on the way out.
We know that the greenhouse effect keeps the Earth a bit over 30 degrees warmer than what it would be without an atmosphere at all, which is a lot in terms of global average temperature. Even a one or two degree change in global average temperature can involve major changes to the climate.
Planets in Universe Sandbox ² have this simple global average energy balance to determine their temperature. You can change the albedo, or see what happens when you move the planet closer to or farther from the nearby star(s). For Earth (and soon Mars) we do something a bit more complicated.
Earth is Frozen at the Poles
Knowing global average temperature is not enough information to determine where it’s cold enough for snow and sea ice to form and where it’s not, and when. If we did the energy balance of each latitude independently, we wouldn’t get it right. The equator would be too warm. The poles would be too cold and have much larger temperature swings with the seasons than actually occur. The reason that the equator and poles aren’t more different in temperature is because the atmosphere and the ocean redistribute energy between the equator and the poles (or meridionally, for along-meridians of North-South lines of longitude).
To do a detailed simulation of equator-pole heat redistribution you’d need a General Circulation Model (or Global Climate Model, GCM), because heat is actually transferred via large-scale circulation of air and ocean water in three dimensions. This would be way too much number-crunching to do on your computer in real-time [1].
 Luckily we can use a simpler model that was popular in the 1970s before computers were quite so powerful, and which is still used to explore basic concepts about the climate. This meridional energy balance model gives us not just a global average surface temperature, but different temperatures at each of a fixed number of latitudes[2]. This model still balances the incoming and outgoing energy globally, but also transfers energy between equator and pole, represented mathematically as a one-dimensional diffusion.
We use a version that gives us two related equations to solve: one for temperature over land, and one for the ocean. Then we do some fancy number-crunching to determine all the temperatures at all the latitudes simultaneously.
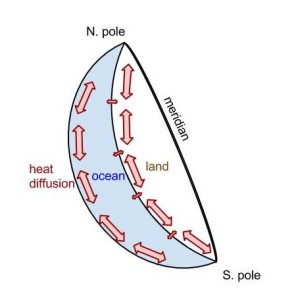
Why is this all necessary?
Without doing a simulation as complicated as this one we could never capture the seasons! Sure we could just make a game that shows you the seasons coming and going without actually calculating all these temperatures, but then it wouldn’t react correctly if you changed the tilt or the orbit of the Earth, and this is a sandbox afterall. We’re always finding the current amount of incoming starlight at each latitude depending on the luminosity of the star, its distance to the Earth, and which latitudes are getting hit with more solar energy on a given day because of Earth’s tilt.
You can also understand one of the self-reinforcing cycles that amplifies changes in the climate. When it gets colder more snow and ice forms, and when there’s more snow and ice the Earth as a whole is more reflective of incoming light. More reflection means less energy coming into the Earth system, which means it gets even colder and more snow and ice forms, and so on. The opposite can happen as well. Thus you’ll see if you move the Earth away from the Sun and freeze it over that you can’t just move it back to where it was before to unfreeze it. You have to move it even closer to the Sun to get enough energy to melt the ice and start the warming version of the albedo feedback going.
There are other self-reinforcing cycles in the climate, which we call feedbacks (think of the piercing noise of a microphone too close to an amplifier – that kind of feedback), as well as other feedbacks that tend to diminish the effects of an initial change and put things back to equilibrium. These processes play a big role in the overall sensitivity of the climate to a disturbance. More on that below.
What’s in the Sandbox?
There are three ways to affect the climate of the Earth in the simulation in Universe Sandbox. First you can change the solar input. Change the luminosity of the Sun (but be careful because you might also end up changing its mass, which will affect the orbits of the planets). Or add an additional star if you really want to heat things up. Or delete the Sun and watch the planet freeze.
Second you can change the orbit of the Earth or its tilt. Changing the tilt will affect how extreme the seasons are. If you give the Earth a less-circular orbit or move it closer to or farther from the Sun, you can see how sensitive we are to being in just the right spot in the solar system.

3 Earths with different climates in Universe Sandbox
(from the left: colder Earth, normal Earth, tidally-locked Earth)
Third you can change the parameters of the model itself. What if the heat capacity of the ocean were larger or smaller? What if the heat were transferred less efficiently between land and ocean, or more efficiently between equator and pole? We’ve chosen values that give us realistic behavior for the Earth we live on, but you can see what would happen if it were different. What values are within a realistic range? It’s a sandbox, so you won’t be constrained by that. How sensitive is the simulation to the choice of parameters? Experiment and see.
Oh, and there’s a fourth way of interacting: some of the parameters are indirectly adjusted for you when you change something else about the atmosphere. When you change the concentration of CO2 we’ll change the amount of outgoing infrared energy. When you change the mass of the atmosphere, that new mass will affect the heat capacities. Keep in mind though that this model is designed to capture the behavior of Earth’s climate in realistic scenarios, and the more impossible or extreme you make the inputs the less exact you should expect the outputs to be.
Simulating Complex Systems
As you’ll see from your experiments, you can gain a lot of intuition about complicated subjects by playing around with a simple model. It turns out, this is not so different from what scientists do sometimes to understand the climate system in more detail. It’s much more costly to run a professional climate model with lots of slight tweaks to parameters, just to see what happens. Such sensitivity studies are done nonetheless to verify models. Does it capture some detail of the climate reasonably? How sensitive is the model is to changes in one input or another?
Using computer models to do numerical experiments is not limited to climate science. The climate is but one case where scientists or social scientists study complex systems by prescribing a set of rules for the behavior of the parts and allowing the numerical simulation to reveal what emerges from how they interrelate[3].
The equations that govern our climate models, be they simplified versions or ones with all the complexity our super-computers can handle, come from basic physics. How they interrelate, the sensitivity of the climate to changes – well, you have to run the model to see.
Modeling Climate Change
The direct radiative effect of the additional greenhouse gases humans have been adding to the atmosphere since the start of the industrial age, is only part of the change in energy balance that warms the planet. The feedbacks in the climate system, including albedo feedback, water vapor feedback, and various interactions within clouds (among others) can amplify or dampen the magnitude of the changes in temperature. This is the more difficult part to understand and simulate, and is responsible for much of the range of predictions of different models.
These essential elements of physical climate predictions are inherently the result of interactions between simulated parts, and can best be understood through model experiments. The basic physics of the greenhouse effect is relatively simple, and it doesn’t require a fancy model to conclude that some global warming is to be expected. The interactions between all the parts of the climate system and the feedbacks – that’s more complicated, and requires a model complicated enough to capture them.
In our case, in Universe Sandbox ² we prescribe a relationship between CO2 amount and the outgoing infrared part of the energy balance so that you can experiment with changes in the quantity of greenhouse gases. What feedbacks affect what happens next? Can you determine the climate sensitivity of this model? Are the changes to sea ice cover realistic? This model is pretty simple, but even so it can give you insight into a lot of questions, and hopefully generate even more.
[1] This is why climate scientists run their state-of-the-art models on supercomputers and it still can take weeks to do a single simulation.
[2] This means we’ve divided up the planet into a fixed number of latitudes – however many we want. We pick a number to balance getting enough resolution to show the differences between latitudes, and trying not to make the software so slow as to overwhelm your computer.
[3] A comprehensive and broad introduction to this kind of modeling that includes socio-economic systems can be found in this classic article. Consider also that the greater portion of uncertainty in the climate predictions comes from the scenarios, which are based on socio-economic assumptions about what people will do in the future. Regardless of the scenario, the amount of warming that a given model predicts in response to a fixed increase in CO2 is known as its sensitivity. We are highly confident that the sensitivity of the real climate is somewhere in the range of what the various models predict.
FAQ
How accurate is your climate model?
As you may see by now, models of complicated systems can become as complicated as you like. Making it more complicated doesn’t necessarily give you more accurate results about the simple parts, it just lets you study more aspects of the problem. This model does some simple things quite well, and is also not the right tool to study most of the details of the climate system. You wouldn’t expect great complexity from the “toy model” that runs in real time on your laptop. But you are running a real simulation on your personal computer which can allow you to explore some simple climate features!
Where can I read more about the nitty gritty (equations please!) of the climate calculations you’re using?
The academic journal article reference that is most directly applicable is North and Coakley, 1979.
The scenarios that now appear for potential future climates are the Representative Concentration Pathways used by the Intergovernmental Panel on Climate Change (more details here). The reported CO2 equivalent concentration is tied to the year once a scenario is enabled, and the associated change in outgoing infrared radiation in the scenario is applied directly to the energy balance.
Why can’t I change the albedo when Climate is enabled?
The climate calculations are determining the overall planetary albedo based on how much of the surface is covered by snow and ice. This is what allows for the albedo feedback to be captured by the calculations. If you turn off albedo feedback, the albedo stays the same no matter what you do.
In the simpler case when the Climate component is not enabled you can change the albedo to see how it influences the temperature. The albedo is a number between zero and one (the higher the number the more reflective the planet.) The answer then is as would be expected from this equation:

where T is the temperature,  is the albedo, S is the incoming solar energy,
  is the Stefan-Boltzmann constant, and
  is the representative overall infrared emissivity, which reflects how much outgoing infrared energy is absorbed and re-emitted by the atmosphere (some of it back towards the surface) on the way.[*]
In a more complicated model, other things would be effecting the albedo as well. Clouds, for example, are even more important than snow and sea ice for the overall global albedo under modern-day Earth conditions.
What’s going on with the clouds?
So far we’re not calculating anything interactively that has to do with the clouds. Most of what you see is visually representative but not simulated. Clouds in the mid-latitudes rotate from West to East, as they do in real life on large-scale. Clouds also fade out when it gets super-hot, super-cold, or super-dry. If you don’t have a giant reservoir of water (the ocean) or it’s totally frozen over and inaccessible to the atmosphere, you won’t have clouds – at least not like the puffy white water clouds we’re used to. And if you make the atmosphere too hot, it will hold more moisture as water vapor and also have fewer clouds (places in the atmosphere where water condenses out into liquid drops).
Later we may make clouds more interactive or let you set some of the parameters.
If you calculate heat diffusion in one equator-pole dimension, how do you decide how to show sea ice and snow at different longitudes?

These are average winter maximum and summer minimum sea ice extents for 1981-2010. See the National Snow and Ice Data Center for more on year-to-year variation, and recent trends.
We make the sea ice edge randomly irregular. Otherwise, based on what we calculate, you’d see smooth concentric circles of ice jumping to higher and lower latitudes. The randomization of the edge makes the sea ice look more “real”, but anyone who has studied Earth’s sea ice will realize that it doesn’t capture the real-life spatial patterns, which do vary geographically depending on basin depth, ocean currents and winds.
What about the snow that forms at higher elevation?
We only calculate one average temperature for each latitude. Then based on the lapse rate, we figure out how high you’d need to be at that latitude in order for it to be cold enough for snow instead of rain. Since we have an elevation map that’s higher resolution than our climate calculations, when we superimpose that snow line onto the elevation map, you can see that higher places are more snow-covered.
Glaciers?
No glaciers yet. We don’t really do anything on such a small scale as a typical glacier. The ice sheets on Greenland and Antarctica are also not modeled at this time in Universe Sandbox. Their greater elevation (from all the ice piled up in real life) usually helps keep them snow covered per our model, as discussed in the last question. But this is why sometimes the edges of those land-masses appear to unfreeze, which is unrealistic. As they lose ice volume in real life, the glacier ice flows out to the ocean, keeping those edges covered.
Because we don’t actually simulate glaciers, there is no change in sea level when Greenland and Antarctica melt. (The sea ice, on the other hand, is a thin skin of ice over the ocean – just a couple of meters thick typically. Because it’s floating on the ocean, melting it doesn’t change sea level anyway.)
Additionally, our elevation model doesn’t have quite the vertical resolution to handle the expected sea level rise of just one or two meters, even though such a change would put a number of important coasts underwater.
When will you simulate life?
Not for a while. For now though you’ll see Earth’s vegetation turn from green to brown when it gets too hot, in case you weren’t keeping an eye on the temperature value or its graph.
* The infrared emissivity is explained in the derivation of the equation.

