ScienceLog

Cloud Speed Simulation | ScienceLog #5
Jul 22nd
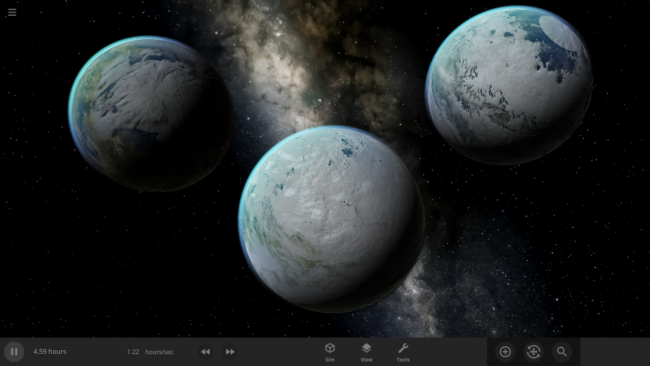
One of our recent improvements to Universe Sandbox includes realistically simulating the speed at which clouds rotate around objects, like planets and moons. While our in-game guide, which can be found under Guides > Science > Clouds, shows off these new features, we wanted to explain them in a little more depth.
To simulate completely realistic clouds, we would need to do a full weather simulation, including the water cycle. As we talk about in our Snow Simulation ScienceLog, this isn’t currently possible without a supercomputer, so for now our clouds are drawn from pre-made cloud pictures. However, we determine the speed at which clouds rotate around an object’s surface from two simulated effects.

Creating Wind
In reality wind is initially created going in an unexpected direction – it travels outwards from the equator to the poles instead of rotating around the equator.
This is because objects are (generally) warmer at their equator and colder at their poles. The higher temperatures at the equator lead to a higher air pressure (essentially the weight of the atmosphere) at the equator, while colder temperatures at the poles lead to lower air pressure. The high pressure air at the equator moves to the lower pressure air at the poles, creating a wind that moves the clouds with it.
This wind moves faster, increasing the cloud speed, the larger the temperature difference between the equator and the poles is, since this will create a larger air pressure difference. In Universe Sandbox we simulate this difference in air pressure between an object’s equator and its poles based on the difference between its Minimum and Maximum Temperature, which are usually at the poles and equator.

Changing the Wind’s Direction
So if wind, and clouds, starts out moving from the equator to the poles, why is it that in reality (and in Universe Sandbox) the wind and clouds move around the Earth’s equator?
This has to do with something called the Coriolis effect – the second effect we simulate for our cloud rotation speeds – which is an effect that occurs on any object that rotates. The Coriolis effect creates a force, called the Coriolis force, that pushes the wind around the Earth’s (or any object’s) equator. The strength of this force increases the faster the object is rotating.
The Resulting Rotation (Speed)
So we now have two effects pushing the winds, and thus clouds, in two different directions:
- The difference in air pressure (and temperature) between the equator and the poles of the object forces the winds to move outwards from the equator to the poles.
- The Coriolis Effect pushes the winds around the equator of an object.
So how do we arrive at the final wind, and cloud, rotation speed? The wind speed will increase until the strength of both effects on the wind is the same. When this happens, the wind and clouds end up rotating around the equator of the object at a constant, unchanging speed. In Universe Sandbox this speed is taken as the Cloud Rotation Speed.
Manipulating the Winds
A really interesting effect that happens when our two simulated effects have the same strength is that the faster an object rotates, the slower the cloud speed will be.
A faster object Rotation Speed creates a stronger force from the Coriolis effect, which allows the two effects to reach an equal strength more quickly. This means that the wind speed has less time to increase before it becomes constant. The result is that the final wind, and Cloud Rotation Speed, is slower.
In addition to Rotation Speed and the Minimum and Maximum Temperature, the strength of the wind that is created from the temperature difference also depends on the Atmosphere Mass, the Surface Gravity, and the Radius of the object (see the Bonus Math section below for details). This is because a more massive atmosphere will slow down the Cloud Rotation Speed, since it is harder to move, and a smaller object radius will increase the Cloud Rotation Speed, since it is easier to move air around a smaller object.
While simulating these effects is a welcomed advancement in our cloud simulation, there are still many improvements we would like to make. This includes dynamically generating clouds and giving them more realistic material compositions. For now, try experimenting with different object properties to see how they affect the Cloud Rotation Speed. We recommend the object’s Rotation Speed, since we can’t slow down the Earth in real life (nor would we want to), this is a great way to see some amazing science at work!
This blog post is part of our ongoing series of ScienceLog articles, intended to share the science behind some of Universe Sandbox’s most interesting features. If you would love to learn about the real-life science powering our simulator, please stay tuned and let us know what you would like to read about next.
To join our community discussions, please join us on our Steam Forum and our official Discord community.
Bonus Math
If you’re interested in exactly how different object properties relate to both the force from the difference in the air pressure between the equator and the poles (called the pressure gradient) and the force from the Coriolis effect (called the Coriolis force) then you’ll enjoy this extra little bit of math.
When we simulate the cloud rotation speed we figure out the pressure difference, ΔP, which is based on the maximum atmosphere surface pressure, Pmax. This is the surface pressure at the equator, and depends on the Atmosphere Mass, M, the Surface Gravity, g, and the radius of the planet, R,
P_{\rm{max}} = Mg/(4 \pi R^{2}).The pressure and temperature of a gas are related (by something called the Ideal Gas Law), so we can compute ΔP using just Pmax and the maximum and minimum temperature, Tmax and Tmin , of the object,
\Delta P = P_{\rm{max}} \left(\frac{T_{\rm{max}}}{T_{\rm{min}}} - 1 \right).Now that we have this pressure difference, we can compute the force, F, that this pressure gradient applies over a certain amount of air mass, m. This force per mass is what causes winds and clouds to move and depends on ΔP (and a few other less important things). That means that this force can change depending on M, g, R, Tmax and Tmin , (that is Atmosphere Mass, Surface Gravity, Radius, Maximum Temperature, and Minimum Temperature respectively) so all of these properties affect the cloud rotation speed,
\frac{F}{m} \propto \Delta P \propto P_{\rm{max}} \times \frac{T_{\rm{max}}}{T_{\rm{min}}} \propto
 \frac{Mg}{R^{2}} \times \frac{T_{\rm{max}}}{T_{\rm{min}}}.
Here the ∝ symbol means “proportional to,” which is similar to an equals sign, “=”, but leaves out some of the less important values. The Coriolis Force also provides a force per mass in order to move clouds. This force is dependent on a few different things, but in particular it depends on the rotation speed of the planet, Ω, and the speed that the wind is already moving due to the pressure gradient, v,
\frac{F}{m} \propto \Omega v.To reach a balanced state where the wind, and clouds, are moving around the equator of an object at a constant speed, the two forces must be equal, leading to the relationship
\Omega v \propto \frac{Mg}{R^{2}} \times \frac{T_{\rm{max}}}{T_{\rm{min}}}.Now the value we want is the wind, or cloud, rotation speed, v. Rearranging the above equation gives us
v \propto \frac{Mg}{\Omega R^{2}} \times \frac{T_{\rm{max}}}{T_{\rm{min}}}.So what does this mean? First, the larger the difference between the minimum and maximum temperature, the faster the clouds will move. This is because a larger temperature difference means a larger pressure difference, thus faster winds.
It also shows mathematically why a more massive atmosphere slows the cloud rotation speed and a smaller radius can dramatically increase the cloud rotation speed like we discussed above.
But the most interesting consequence of this relationship is that it shows why it is that the faster an object rotates, the slower the cloud speed will be. This result was so surprising to us at first that we had to triple check it (we’re convinced it is correct now, don’t worry). While it’s impossible to slow down the Earth’s rotation in reality (not to mention the immense destruction that would cause if we could), exploring in Universe Sandbox allows you to see the consequences of some beautiful math for yourself.

Simulating Snow | ScienceLog #4
May 20th
It turns out it’s a lot harder to simulate snow, or any weather for that matter, than it is to simulate regular surface water. In Universe Sandbox the phases of water on the surface of an object depend just on the sea level temperature, and we even make sure to conserve the total surface water mass in all of its phases, which you can find under Properties > Surface > Total Water Mass. However, because snow depends on so many other conditions we don’t keep track of it in the same way.
Like all phases of water, snow is also tracked with surface grids, which we discussed in our first ScienceLog. We simulate snow by checking if each point on the surface grid has the right elevation, amount of water vapor, and surface temperature, needed for snow to form. If the point meets all of our checks, we know snow needs to be added to that point. This is much more complex than how we simulate ice, which only depends on whether the sea level temperature of a point on the surface grid is below freezing.
As of Update 27 we’re also keeping a record of where snow is being formed. One thing this allows us to do now is add and remove snow more realistically. This is a big improvement over our previous snow simulation where snow would just appear and disappear instantaneously depending on the properties of each point on the surface grid at any given time. We’re also doing a better job of simulating snow and ice on random planets by stabilizing the water phases and then running our snow checks when the planet is created.
At the Speed of Snow
Now, you may be wondering why we don’t just simulate snow with the rest of the phases of water. To do that, we would need to simulate the entire water cycle, which we just can’t do accurately at simulation speeds faster than about one second per second on a desktop computer (yet). Even organizations like NASA need supercomputers to accurately simulate weather! This limitation comes from how fast we can allow water to flow through the points on a surface grid and maintain a stable surface simulation. In the water cycle, the phases change much faster than we can simulate the flow rate of water. This means we can’t keep track of which points should have which phases. For simulating the phase changes of water on the surface of a planet, like liquid water to ice, we aren’t limited because the flow rate of water is faster than the phase changes of this surface water. However, as consumer computers get faster, our snow simulation has the potential to become more realistic. So while we may not have personal supercomputers anytime soon, you can still check out how much better snow looks by checking out the Tidally Locked Earth or Mars Collisions Sims.
This blog post is part of our ongoing series of ScienceLog articles, intended to share the science behind some of Universe Sandbox’s most interesting features. If you would love to learn about the real-life science powering our simulator, please stay tuned and let us know what you would like to read about next.
To join our community discussions, please join us on our Steam Forum and our official Discord community.
The End of the World: Slower Than You Expected | ScienceLog #3
Mar 25th
Sure, the Sun’s pretty useful, we guess. It feeds Earth’s plant life, keeps us warm, and helps people see where they’re going when they walk around outside. If the Sun suddenly disappeared from the Solar System (which you can do with the click of a button in Universe Sandbox!), we’d be in big trouble.* In fact, right now you’re probably imagining the desolate, frozen landscape that our planet would become without its Sun. But this apocalypse wouldn’t happen quite as fast as you probably think:
If the Sun disappeared, it would take over a century for the Earth’s oceans to completely freeze solid!
Universe Sandbox lets you perform this kind of catastrophic experiment from the safety and comfort of your own home by simulating three phases of water (solid, liquid, and gas), and how they react to the changing environment. As a planet cools, its surface water will freeze into ice. Heat that planet back up with a laser, and the ice will melt and even vaporize into gas.
But you might have noticed that some of these phase changes take longer than you expect them to. If you’ve found yourself wondering “Why is it taking so long for the oceans to freeze?” or “I’ve been waiting for ages for the ice caps to melt, what’s going on??”, read on to learn more about the physics (and speed) of phase changes.
Energy Flow… Again
In ScienceLog #1, we explained how the flow of energy into and out of a planet will affect that planet’s temperature. In fact, the flow of energy also affects the phase of water.
As you know if you’ve ever boiled a pot of water, you need to add energy to turn water from a liquid to a gas. The opposite phase change— condensing water vapor into a liquid— involves the release of energy into the cooler environment surrounding the water. Similarly, energy needs to flow into a block of ice to melt it into water, but energy must flow out of a pool of water in order to turn it into ice. We can figure out how fast a phase change is occurring based on the speed at which energy is flowing into or out of the water.
The key point here is that phase changes are not instantaneous. You’ve probably already noticed that, if you pay attention to phase changes in your daily life: It can take a few days for snow to melt after a big blizzard, even if the temperature rises above freezing. Even ice doesn’t melt instantly in your drink on a hot day. And of course, we all know that water never boils as fast as we want it to, even if we set it on high heat.
The speed of a phase change of surface water in Universe Sandbox will depend on the temperature of the surface, the freezing or boiling point of water, and the mass of water that you’re trying to change. This last factor, the mass of the water, is probably the source of most of the confusion about this issue in Universe Sandbox. Since we’re all used to seeing phase changes in our everyday lives, we have some intuition for how fast we think they should happen. But the masses of the Earth’s ice caps or oceans are much, much larger than an ice cube or a kettle of water, and this significantly slows down the rate of boiling, melting, and any other phase change.
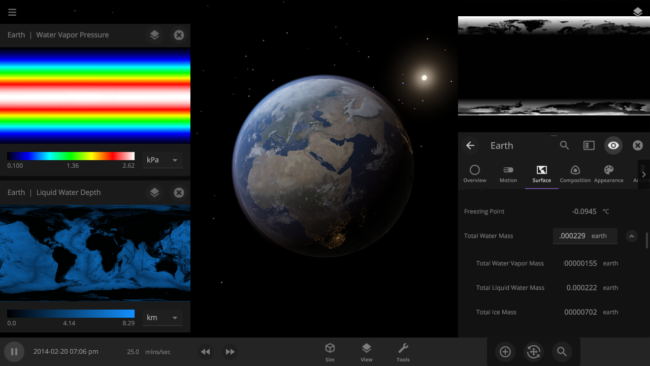
The heat from the too-close Sun is melting the Earth’s ice quickly, as you can see in the Total Ice Mass graph on the left, but not instantly.
That’s why you might have to wait a while for your simulated planet’s oceans to freeze or boil (depending on what you’ve done to that poor planet). Of course, if you get impatient, you can always use the new Stabilize Phases button in the Surface tab to instantly change the surface water to the correct phase based on the local temperature. What a convenient apocalypse!
…
…What’s that? You still don’t believe us that it would take a century to freeze the Earth’s oceans?
…
…You want some proof in the form of equations and hard numbers?
…
…All right, you asked for it. If you’re still with us, read on for the juicy, math-y details:
Bonus Math: How Long Does It Take to Freeze the Earth’s Oceans?
We’re going to put our money where our math is and walk through an example. Suppose we want to freeze all the water on Earth into ice. We could do this by deleting the Sun in the Solar System, although then we’d have to wait for the Earth to slowly cool down. If we’re impatient, we can skip ahead by just setting the Earth’s Average Surface Temperature to the lowest possible temperature: -273°C, or zero Kelvin (also known as “absolute zero”).
If you try this in Universe Sandbox, you’ll notice that after you change the temperature, the oceans are still made of liquid water. How long should we expect it to take to freeze all that water into ice: Days? Weeks? Months?
Let’s start by asking how much water we’re trying to freeze. Earth’s oceans have a mass of roughly 1.4 thousand billion billion kilograms. In scientific notation, that’s 1.4 x 10²¹ kg of water. To turn the liquid water into a solid, we need to remove energy from it. Since the water hasn’t frozen yet, its temperature is sitting at the freezing point, around 273 Kelvin. Since the Earth itself is at zero Kelvin, the heat energy in the water will flow into the Earth (and then out into space).
Our next question is: How much energy needs to flow out of the water in order to freeze it? To answer this question, we use a property of water called the Heat of Fusion. This property represents how much energy, in Joules, is required to melt one kilogram of ice into water, or, conversely, how much energy must be removed to freeze one kilogram of water into ice. You can look up the Heat of Fusion for many different materials online— For water, it’s about 3.3 x 10⁵ Joules per kilogram.
This means that the amount of energy that must be removed from Earth’s oceans to freeze them entirely into water is:
\text{Energy} = \text{Mass} \times \text{Heat of Fusion} = (1.4 \times 10^{21} \text{kg}) \times (3.3 \times 10^5 \frac{\text{J}}{\text{kg}}) = 4.62 \times 10^{26} \text{J}
That’s roughly the amount of energy that would be released by two billion Tsar Bomba hydrogen bombs, the most powerful nuclear weapon ever created.
Now we need to know the speed at which energy is flowing out of the water, and into its zero Kelvin environment. For this, we can use the Stefan-Boltzman law, which says that an object with temperature T will lose energy through its surface at a rate of
\text{Rate} = \sigma T^{4}Awhere σ, the Greek letter “sigma”, represents the Stefan-Boltzmann constant, and the A is the surface area of the object.
The surface area of the Earth is about 5.1 x 10¹⁴ m2, so the rate at which the oceans are losing energy is roughly
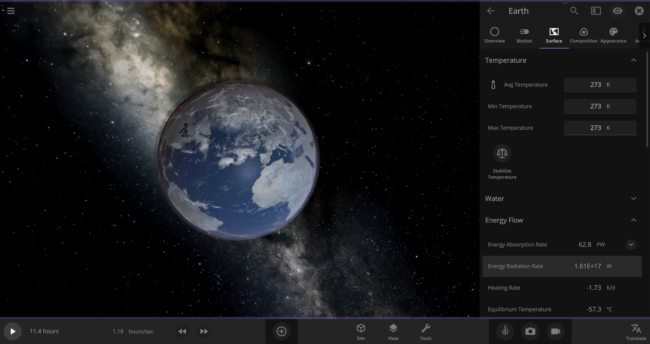
\text{Rate} = (5.7 \times 10^{-8} \frac{\text{J}}{\text{s m}^{2}~\text{K}^{4}}) \times (273~\text{K})^{4} \times (5.1 \times 10^{14}~\text{m}^{2}) = 1.61 \times 10^{17}~\text{J/s}We can actually double-check this number in the game: First, put the Earth in an empty simulation. Then set Earth’s Average Surface Temperature to 273 Kelvin and look at the Energy Radiation Rate property. As expected, it shows that this Earth is losing energy at a rate of 1.61 x 10¹⁷ W (the Watts unit is equivalent to Joules per second).
Back to our zero-Kelvin Earth: you probably know that only about 70% of our planet’s surface is covered in water. Since we’re only interested in how fast the oceans are losing heat, we should use a reduced rate of
\text{Rate} = 1.61 \times 10^{17}~\text{J/s} * 0.70 = 1.13 \times 10^{17}~\text{J/s}We now know how much energy we need the oceans to lose in order to freeze them all, and how fast they are losing energy to their surroundings. Now we can easily calculate the time it will take for the oceans to lose the required amount of energy:
\text{Time} = \text{Energy / Rate} = (4.62 \times 10^{26}~\text{J}) / (1.13 \times 10^{17}~\text{J/s}) = 4.09 \times 10^{9}~\text{s}There are about 3.15 x 10⁷ seconds in a year, so that’s
\text{Time} = (4.09 \times 10^{9}~\text{s}) / (3.15 \times 10^{7}~\text{s/yr}) = 132~\text{yr}In other words, we estimate that it would take over 100 years(!) for the Earth’s oceans to completely freeze if the Earth’s temperature suddenly dropped to absolute zero. In real life, it would likely take even longer: The layer of ice that would form on top of the oceans would insulate the liquid water underneath, keeping it from freezing from much longer. Geothermal vents at the bottom of the oceans could also keep temperatures cozy for the microorganisms that live down there, possibly for billions of years.
If you’d rather go in the opposite direction and try to boil away Earth’s oceans by heating up the planet, you might find that it takes even more energy! That’s because the energy needed to change water from a liquid to a gas, known as the Heat of Vaporization, is almost ten times its Heat of Fusion. You can explore exactly this scenario in our Welcome | Part 2 guide, which you can find in Home > Guides > Tutorials. You can also learn more about how Universe Sandbox simulates the surface temperatures of objects in the Surface Simulation or the Energy & Heating tutorials.
Assumptions Addendum
Based on some comments we’ve received about the assumptions we made for this calculation, we wanted to go into a bit more depth about what they are, and why they may (or may not) be important. You’ll notice that because of these assumptions, the 132 years that we come up with really represents a minimum amount of time it would take for the oceans to freeze solid.
- Space is actually 3°K, not 0°K:
Yes, that’s true, the ambient temperature of empty space is around 2.7°K due to the cosmic microwave background. However, after the Sun disappears, the Earth is still much hotter than the temperature of space, and the difference between 0°K and 2.7°K is small, so this would not notably affect the speed of cooling. - We didn’t consider atmospheric heating (the greenhouse effect):
No we didn’t, though it is included in the Energy Absorption Rate in Universe Sandbox, so you can go see how large an effect this is by running the simulation for yourself! This effect actually makes the largest difference in the time it would take for the oceans to freeze. This Atmosphere Power is actually based on the infrared emissivity, ε, of Earth, a measure of how efficiently it emits infrared radiation. For Earth this is about 0.78 on a scale of 0-1 (1 being very efficient). The energy radiated back at Earth by the atmosphere is then calculated as:
P_{\rm{atm}} = \frac{\epsilon}{2} \sigma T^4 Awhere again σ, the Greek letter “sigma”, represents the Stefan-Boltzmann constant, and the A is the surface area of the object, and T is the temperature. Which works out to be 39% of the Energy Radiation Rate of Earth. So this means that the cooling rate is significantly slower when you take atmospheric heating into effect, adding another 83 years or so to the time it would take for Earth’s oceans to freeze solid.
- We didn’t discuss tidal forces:
True, we did not discuss tidal forces, but they are also computed in Universe Sandbox as part of the Energy Absorption Rate. However, once you get rid of the Sun, the additional heating from tidal forces is over a million times smaller than the Energy Radiation Rate. The main source of tidal heating once the Sun is gone is the Moon, which adds about 2 terawatts of constant power (though it varies very slightly). This additional energy would only delay Earth’s oceans from freezing over for another day or so. - We didn’t consider geothermal (internal) heating:
Geothermal vents are mentioned in the last sentence of the second-to-last paragraph, but you’re right that we did not include them in our calculations. In fact, that property is not simulated in Universe Sandbox. However, assuming this rate is constant at providing 47 terawatts of power, this is still about 1000 times smaller than the Energy Radiation Rate, and would only add about 20 more days to the total time that it would take to freeze the Oceans. - Earth is not a perfect blackbody:
That’s also true. In many astronomical fields, celestial objects are approximated as blackbodies not only because it makes the math much easier, but also because we don’t know their exact emission and absorption properties, and it tends to be a pretty accurate approximation. This is why we approximate all of our objects as blackbodies to compute the Energy Radiation Rate in Universe Sandbox. Even though Earth is not a perfect blackbody, the difference between it’s blackbody temperature and measured temperature is only a few degrees Celsius (not including the greenhouse effect).
Another assumption we made was that the surface temperature of the Earth would be starting at 0°K. As we mentioned, if we don’t start Earth at 0 °K, then we need to wait for it to cool off enough that it’s oceans would start to freeze, making it take even longer for Earth’s oceans to freeze solid. We dynamically compute the temperature of an object and its subsequent Energy Absorption and Radiation Rates in Universe Sandbox each second, so you can actually watch it cool in real time. Computing the exact amount of additional time this cooling would add is quite complicated. But we can run the simulation in Universe Sandbox and find that this will add another 100 years or so to the total time that it will take Earth’s oceans to freeze solid.
Since we do include atmospheric and tidal heating in Universe Sandbox, I encourage you to go and delete the Sun yourselves and see how long it takes for the oceans to freeze solid!
*So how long would you survive after the Sun disappeared? It would depend a lot on where you live and how much food you have on hand. The crops we depend on for food need sunlight to grow, although larger plants like trees can have enough energy stored to last for years without the Sun. Many people would probably freeze to death before they starved. Some people might last for a few months, especially those living in places like Yellowstone or Iceland with a lot of geothermal activity. After a few years, though, the Earth’s surface would grow so cold that the atmosphere would condense, and there’d be nothing left to breathe. It really makes you appreciate our nearest star, doesn’t it?
This blog post is part of our ongoing series of ScienceLog articles, intended to share the science behind some of Universe Sandbox’s most interesting features. If you would love to learn about the real-life science powering our simulator, please stay tuned and let us know what you would like to read about next.
To join our community discussions, please join us on our Steam Forum and our official Discord community.
Updated April 30, 2021

Tidal Heating | ScienceLog #2
Oct 15th

Simulation in which the Moon orbits way too close to the Earth. Tidal forces from the Earth’s gravity rip fragments from the Moon, tearing it apart.
New and Improved Tidal Heating
Our first ScienceLog explained how the flow of energy into and out of an object is responsible for heating or cooling the object. If you look at the sources of energy in a simulation, listed in the Energy Flow section of the object’s Surface tab, you’ll see Tidal Power listed. Unlike some of the other heat sources, like stars or impacts, tidal heating originates inside the object itself.
Tidal heating has been a part of Universe Sandbox for some time, but after the release of our new Surface Grids feature in Update 24, we noticed that tidal heating wasn’t changing the temperature of planets the way we expected. We traced this unusual behavior back to some errors in our tidal heating calculations, and then we fixed those bugs while we prepared the energy flow tools for Update 25.
Now that we’re more confident in our tidal heating simulation, we thought that for this ScienceLog, we’d dive a little deeper into tidal heating, where it comes from, and how it works in Universe Sandbox. It may not be as flashy as other heating sources, like supernovas or lasers, but tidal heating can create some unexpected and interesting effects, and even determine the habitability of a planet or moon!
What is Tidal Heating?
As usual, it all comes back to gravity. The force of gravity depends on the distance between objects. For example, the strength of Earth’s gravitational pull on the Moon is stronger on the side of the Moon that’s facing the Earth than on the far side of the Moon. This difference, called the tidal force, can stretch the Moon out of its normally spherical shape. If the tidal forces are strong enough, they can even rip an object apart through a process called Roche fragmentation.

Jupiter’s moon Io orbiting the gas giant in a simulation with just Jupiter and its moons. Io’s eccentric orbit creates tidal friction inside the moon, and the graph of Tidal Power on the left shows how the incoming rate of tidal energy changed over time. In real life, astronomers believe this tidal heating is the source of energy for Io’s many volcanoes.
Smaller tidal forces will leave the object intact, and the “squishing” of the object’s spherical shape is usually too small to see. But if the tidal forces change over time— say, because the object is spinning, or its orbit is non-circular (elliptical)— all this squishing and un-squishing will create friction inside the object, which will add heat energy.
How Does Tidal Heating Work in Universe Sandbox?
As the simulation runs, Universe Sandbox is constantly calculating the gravitational forces pulling on every object. We use these calculations to determine where each object will move next, and how fast, but we can also use them to calculate the strength of the tidal forces inside the object. If these forces are strong enough, the simulation produces fragments to simulate Roche fragmentation tearing the object apart. It also calculates how much heating is produced by tidal friction, and sends that information into the energy flow calculations that control the object’s temperature.
With the improvements in Update 25, we’re now much more confident in our tidal heating model. We even made a new simulation to show it off: A Tidally Heated Habitable Moon. This sim demonstrates a scenario predicted by some astronomers: a moon orbiting a gas giant outside of its star’s habitable zone. Normally this distance would make the moon’s surface too cold to support liquid water, but tidal forces from the gas giant heat the moon’s surface to a balmy, habitable 14.9°C.
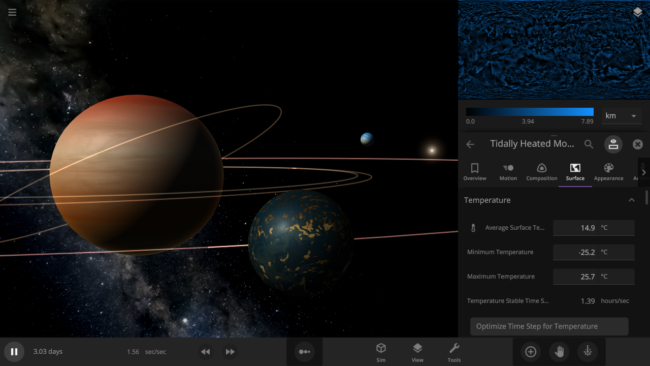
A tidally heated habitable moon located outside of the habitable zone. The warmer surface temperature, due to tidal heating, allows liquid water to flow on this moon.
Try creating your own tidal heating simulations, and experiment with the masses and orbits of objects (especially the orbital eccentricity) to see how these properties affect the amount of tidal power added to an object. Can you make a habitable moon or planet outside the habitable zone?
Note: You may have noticed the odd looking spike in the “Jupiter’s moon Io orbiting the gas giant” graph. One of the challenges that comes with simulating complex features like tidal heating in Universe Sandbox is that when you increase the speed of the simulation, accuracy in the calculations can decrease. These abnormalities occur because there are less points of data to reference. The graph could be smoothed out by estimating data points in between, but that would introduce inaccurate data, and we’re all about accuracy here.
This blog post is part of our ongoing series of ScienceLog articles, intended to share the science behind some of Universe Sandbox’s most interesting features. If you would love to learn about the real-life science powering our simulator, please stay tuned and let us know what you would like to read about next.
To join our community discussions, please join us on our Steam Forum and our official Discord community.

Energy and Heating | ScienceLog #1
Jul 23rd
Jupiter orbiting a mere 0.04 AU from the Sun, heating quickly under the intense stellar energy it receives at this distance.
It’s Getting Hot in Here…
One of the many important astrophysical processes that Universe Sandbox simulates is the changing temperature of an object as it is warmed by nearby stars and other sources of heat. Thanks to our new Surface Grids feature, introduced in Update 24, Universe Sandbox can now simulate the heating of each point on an object’s surface, to create a 2D map of a planet or moon’s surface temperature.
In addition to the Surface Grids simulation in Update 24, we also added new properties and tools related to heat and temperature in Update 25, so we wanted to take this opportunity to explain what makes planets get so hot (or cold!), and how you can use Universe Sandbox to explore the flow of energy through your objects.
Go with the Flow: Energy Flow and Temperature
So what makes the temperature of an object change? It all comes down to energy. An object like a planet or moon is continuously absorbing energy from its surroundings (like the heat from nearby stars) and radiating energy out into space. If the object is absorbing more energy than it is radiating away, that extra energy is used to raise the temperature of the object. On the other hand, if the object is radiating more energy than it’s receiving, that lost energy causes the object’s temperature to drop.
Universe Sandbox simulates the temperature of an object based on the flow of energy into and out of the object. You can see the data related to this “Energy Flow” in the Surface tab in the object’s properties panel. The first two properties, Energy Absorption Rate and Energy Radiation Rate, show the speed at which the object is gaining and losing energy. The Heating Rate tells you how fast the object’s surface temperature is expected to change based on this energy flow. If the object is absorbing more energy than it’s radiating, the Heating Rate will be positive, and the object will heat up. If it’s radiating more energy than it’s absorbing, the Heating rate will be negative, and the object will cool down.
Try experimenting with properties like the object’s Average Albedo or Surface Heat Capacity to see how they affect the energy flow rates and surface temperature (or check out our Energy Flow guide in Home > Guides > Tutorials > 14 – Energy and Heating).
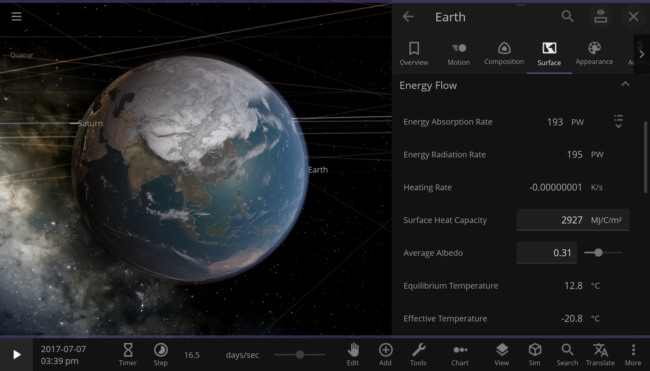
The Earth in the Solar System, with the Energy Flow section displayed in its properties panel.
Heat Wave: Sources of Heat Energy
What are these sources of energy that can heat an object in Universe Sandbox? Energy from stars is the major source of heat in most simulations. These heat sources are directional: they only heat the part of the object’s surface facing the star. Heating from supernova explosions is also directional, not to mention extremely powerful.
The Earth, heated by a recently exploded Sun. The directional heating from the supernova causes the side of the Earth facing the supernova to receive all the heat energy. Eventually, the Earth absorbs too much energy, too fast, and it is vaporized away.
Other sources of heat come from all directions at once, or from inside the object, so the heat energy is evenly distributed over the object’s surface. For example, objects with atmospheres are heated by energy that the atmosphere radiates back down towards the surface. (This is the mechanism that causes the greenhouse effect leading to the climate crisis here on real-life Earth.)
All these contributions to the heating of an object are listed in the Energy Flow section, and can be seen by expanding the Energy Absorption Rate property (by selecting the list icon on the right side of the property).
Temperature Simulation in Two Dimensions
The properties in the Energy Flow section are used to estimate the change in the object’s Average Surface Temperature, a single value that represents the temperature of the object as a whole. The Surface Grids feature also allows us to simulate this energy flow and heating process at every point on an object’s surface. You can see the object’s 2D temperature map at the top of the Surface tab. Hovering over a pixel on the map will display the temperature at that point.
This temperature map is especially useful for seeing the effects of directional heating. For example, selecting Tidally Lock in an object’s Motion tab will change the object’s rotation period such that one side of the object always faces its star and the other always faces away from the star. If we tidally lock the Earth, the hemisphere facing away from the Sun will get so cold that the ocean freezes over, while the side facing the Sun gets uncomfortably warm. Even though the Earth as a whole is receiving the same amount of energy from the Sun, the conditions on the surface, simulated by Surface Grids, have changed a lot!
A tidally-locked Earth, spinning so slowly that one side always faces the Sun and the other always faces away. The “night” side gets so cold that it freezes over, while the “day” side continues to heat in the constant, direct sunlight.
This blog post is the first in our new series of ScienceLog articles, intended to share the science behind some of Universe Sandbox’s most interesting features. If you would love to learn about the real-life science powering our simulator, please stay tuned and let us know what you would like to read about next.
To join our community discussions, please join us on our Steam Forum and our official Discord community.